A/B Test Runner in Machine Learning
Here is the uncomfortable truth about machine learning: your model's offline metrics -- AUC, F1, NDCG -- are educated guesses about production performance, nothing more. The A/B Test Runner is the block that bridges the gap between "looks good in a notebook" and "actually moves the business needle."
An A/B test (also called an online controlled experiment or a split test) randomly assigns users to either a control group (existing experience) or a treatment group (new ML model, feature, or algorithm), then measures the causal impact on predefined metrics with statistical rigor. It is the gold standard for causal inference in production systems because it eliminates confounders through randomization -- something no amount of offline evaluation can achieve.
Every major technology company runs A/B tests at industrial scale. Booking.com runs roughly 1,000 experiments concurrently across 75 countries and 43 languages. Netflix funnels every product change through its experimentation platform before it becomes the default experience. Microsoft, LinkedIn, and Google each execute over 20,000 controlled experiments per year. At Airbnb, out of 250 ideas tested in controlled experiments, only 20 proved to have a positive impact on key metrics -- meaning over 90% of ideas failed to move the needle. Those that succeeded delivered a 6% improvement in booking conversion worth hundreds of millions of dollars.
In the Indian tech ecosystem, companies like Flipkart, Swiggy, Razorpay, Zerodha, and PhonePe use experimentation platforms to validate everything from search ranking changes and recommendation algorithms to payment gateway optimizations and pricing strategies. For any ML system design interview or real production system, understanding A/B testing is not optional -- it is the final validation gate between an ML model and the real world.
This guide covers everything you need to design, run, and analyze A/B tests for ML models: from sample size calculation and randomization to Bayesian vs frequentist analysis, multi-armed bandits, guardrail metrics, and the platforms that operationalize it all.
Concept Snapshot
- What It Is
- A statistical experimentation framework that randomly splits users into control and treatment groups to measure the causal impact of a new ML model, feature, or algorithm on predefined business and product metrics.
- Category
- Evaluation
- Complexity
- Advanced
- Inputs / Outputs
- Inputs: control group traffic (existing model/experience), treatment group traffic (new model/experience), and metric definitions. Outputs: treatment effect estimates, confidence intervals, p-values (frequentist) or posterior probabilities (Bayesian), and go/no-go deployment decisions.
- System Placement
- Sits at the final validation stage of the ML pipeline, after offline evaluation (AUC, F1, etc.) and before full production rollout. Typically follows shadow mode or canary deployment and precedes progressive rollout.
- Also Known As
- Online Controlled Experiment, Split Test, Randomized Controlled Trial (RCT), Bucket Test, Online Experiment, Live Experiment
- Typical Users
- ML Engineers, Data Scientists, Product Managers, Growth Engineers, Applied Scientists, Experimentation Platform Engineers
- Prerequisites
- Hypothesis testing (null and alternative hypotheses), P-values and confidence intervals, Statistical power and sample size calculation, Basic probability distributions (normal, binomial), Understanding of type I and type II errors, Familiarity with randomization and causal inference
- Key Terms
- MDE (Minimum Detectable Effect)statistical significancestatistical powerrandomization unitguardrail metricprimary metric (OEC)CUPED variance reductionsequential testingmulti-armed banditBayesian posteriornovelty effectSimpson's paradox
Why This Concept Exists
The Offline-Online Gap
Every ML practitioner has lived this story: you train a model, it beats the baseline on every offline metric, you celebrate, you deploy it -- and nothing happens. Or worse, your key business metric drops. Why?
Offline evaluation computes metrics on static, historical data. But production is a living, breathing system with feedback loops, user behavior changes, latency effects, and interactions with other features. A recommendation model that achieves NDCG@10 = 0.42 in offline evaluation might degrade click-through rates in production because it surfaces unexpected items that confuse users, or because its inference latency is 50ms slower than the incumbent, causing abandonment.
The fundamental problem is confounding. When you deploy a new model and observe a change in metrics, how do you know the model caused the change? Maybe it was a seasonal effect, a marketing campaign, a competitor's action, or a platform outage. Without a randomized control group, you cannot isolate the model's causal effect from these confounders.
The Solution: Randomized Experiments
A/B testing solves this with a beautifully simple idea borrowed from clinical trials: randomly assign users to groups, apply the treatment (new model) to one group, keep the other group on the control (existing model), and compare outcomes. Because assignment is random, the groups are statistically equivalent on all observed and unobserved confounders. Any difference in outcomes is attributable to the treatment.
This is the same principle behind randomized controlled trials (RCTs) in medicine, which are considered the gold standard for establishing causation. The key insight is that randomization creates a counterfactual -- group B tells you what would have happened to group A had they not received the treatment.
Evolution of Online Experimentation
The history of A/B testing in tech is surprisingly recent. Amazon was one of the earliest adopters in the late 1990s, using controlled experiments to optimize its website. Google famously tested 41 shades of blue for link color in 2009, though this story is often cited as an example of experimentation excess rather than best practice.
The real inflection point came with Ronny Kohavi's work at Microsoft and later Airbnb, codified in the influential book Trustworthy Online Controlled Experiments (2020). Kohavi demonstrated that most product changes that teams believe will improve metrics actually do not -- the "most ideas fail" finding has been replicated across dozens of companies. This humbling observation made A/B testing a non-negotiable step in product development.
Today, experimentation has evolved from simple two-variant tests to sophisticated platforms supporting sequential testing (safe peeking), CUPED variance reduction (detecting smaller effects with fewer samples), multi-armed bandits (adaptive allocation), and interleaving experiments (for ranking systems). The A/B Test Runner block encapsulates this entire ecosystem.
Key Insight: A/B testing exists because human intuition about what works is unreliable, offline metrics are imperfect proxies for business outcomes, and only randomization can establish causation. It is the bridge between "the model improved offline" and "the model improved the business."
Core Intuition & Mental Model
The Courtroom Analogy
Think of an A/B test as a trial in court. The null hypothesis (H0) is that the defendant (new model) is innocent -- it has no effect compared to the control. The alternative hypothesis (H1) is that the new model is guilty -- it does have an effect.
Your job as the experimenter is to collect evidence (data from control and treatment groups) and decide whether the evidence is strong enough to convict (reject H0). The significance level (alpha, typically 0.05) is your standard of proof: you will only convict if the probability of seeing this evidence under innocence is less than 5%. Statistical power (1 - beta, typically 0.80) is the probability that you will convict a truly guilty defendant -- how sensitive your evidence collection is.
Here is the catch: if you have too little evidence (small sample size), you cannot convict even a clearly guilty defendant (the effect exists but you cannot detect it). If you peek at the evidence halfway through the trial and decide early ("peeking problem"), you inflate your false conviction rate. And if you keep running the trial indefinitely until you see a conviction ("optional stopping"), you are guaranteed to eventually convict an innocent defendant.
These are not abstract concerns -- they are the most common mistakes in real A/B testing.
The Three Numbers That Matter
Every A/B test boils down to three numbers:
-
Minimum Detectable Effect (MDE): The smallest improvement worth detecting. If your baseline conversion rate is 5% and you only care about changes larger than 0.5 percentage points (relative lift of 10%), your MDE is 0.5pp. Smaller MDE requires exponentially more samples.
-
Statistical Power (1 - beta): The probability of detecting the MDE if it truly exists. Set at 0.80 by convention (80% chance of detecting a real effect). Increasing power to 0.90 roughly doubles your required sample size.
-
Significance Level (alpha): The probability of a false positive (concluding the treatment works when it does not). Set at 0.05 by convention (5% false positive rate).
These three numbers, plus your baseline metric variance, determine your required sample size. There is no magic here -- it is a mechanical calculation. The hard part is choosing MDE: too large and you miss real improvements, too small and you need millions of users.
Why Most A/B Tests Fail
Industry estimates suggest that 80% of A/B tests fail to produce a statistically significant winner. This is not because experimentation is broken; it is because most changes simply do not have a meaningful effect. Booking.com, one of the most experimentation-driven companies in the world, reports that the vast majority of their tests are neutral. Airbnb found that only 8% of tested ideas moved the needle.
This is actually good news. It means A/B testing is doing its job: preventing you from shipping changes that feel impactful but are not. The test is a filter, and most ideas do not pass.
Technical Foundations
Statistical Framework
Let denote the potential outcome for user under treatment and under control. The Average Treatment Effect (ATE) is:
Since we cannot observe both potential outcomes for the same user (the fundamental problem of causal inference), randomization ensures:
is an unbiased estimator of .
Two-Sample Z-Test (Most Common)
For a metric with sample means , and sample variances , with and observations:
Reject if (two-sided test). For , the critical value is .
Sample Size Formula
For a two-sided test with significance level , power , and minimum detectable effect :
where is the variance of the metric. For binary metrics (e.g., conversion rate ), .
Example: Baseline conversion , MDE (10% relative lift), , power = 0.80:
So you need roughly 60,000 total users for this experiment.
CUPED Variance Reduction
Controlled-experiment Using Pre-Experiment Data (CUPED) reduces variance by leveraging a pre-experiment covariate correlated with the outcome :
where . This reduces variance by a factor of where is the correlation between and . If , variance reduces by 25%, effectively giving you 33% more data for free.
Bayesian Framework
In Bayesian A/B testing, we model the treatment effect with a prior distribution and update it with observed data to obtain the posterior :
The decision criterion is typically: deploy treatment if (95% probability that treatment is better). Unlike frequentist testing, Bayesian methods allow continuous monitoring without inflating false positive rates, because the posterior probability is always valid.
Sequential Testing
Sequential tests use always-valid p-values or confidence sequences that maintain type I error control under continuous monitoring. The mixture sequential probability ratio test (mSPRT) defines:
where is a mixing distribution over alternatives. Reject when . This allows safe "peeking" at results without inflating false positives.
Note: The sample size formula assumes equal-sized groups and a two-sided test. For unequal allocation (e.g., 90/10 split), multiply by where . Unequal splits reduce statistical power for a given total sample size -- the 50/50 split is always most efficient.
Internal Architecture
An A/B Test Runner is a multi-component system that orchestrates the entire lifecycle of an online experiment: from experiment configuration and user randomization through metric collection, statistical analysis, and decision-making. Here is the high-level architecture:
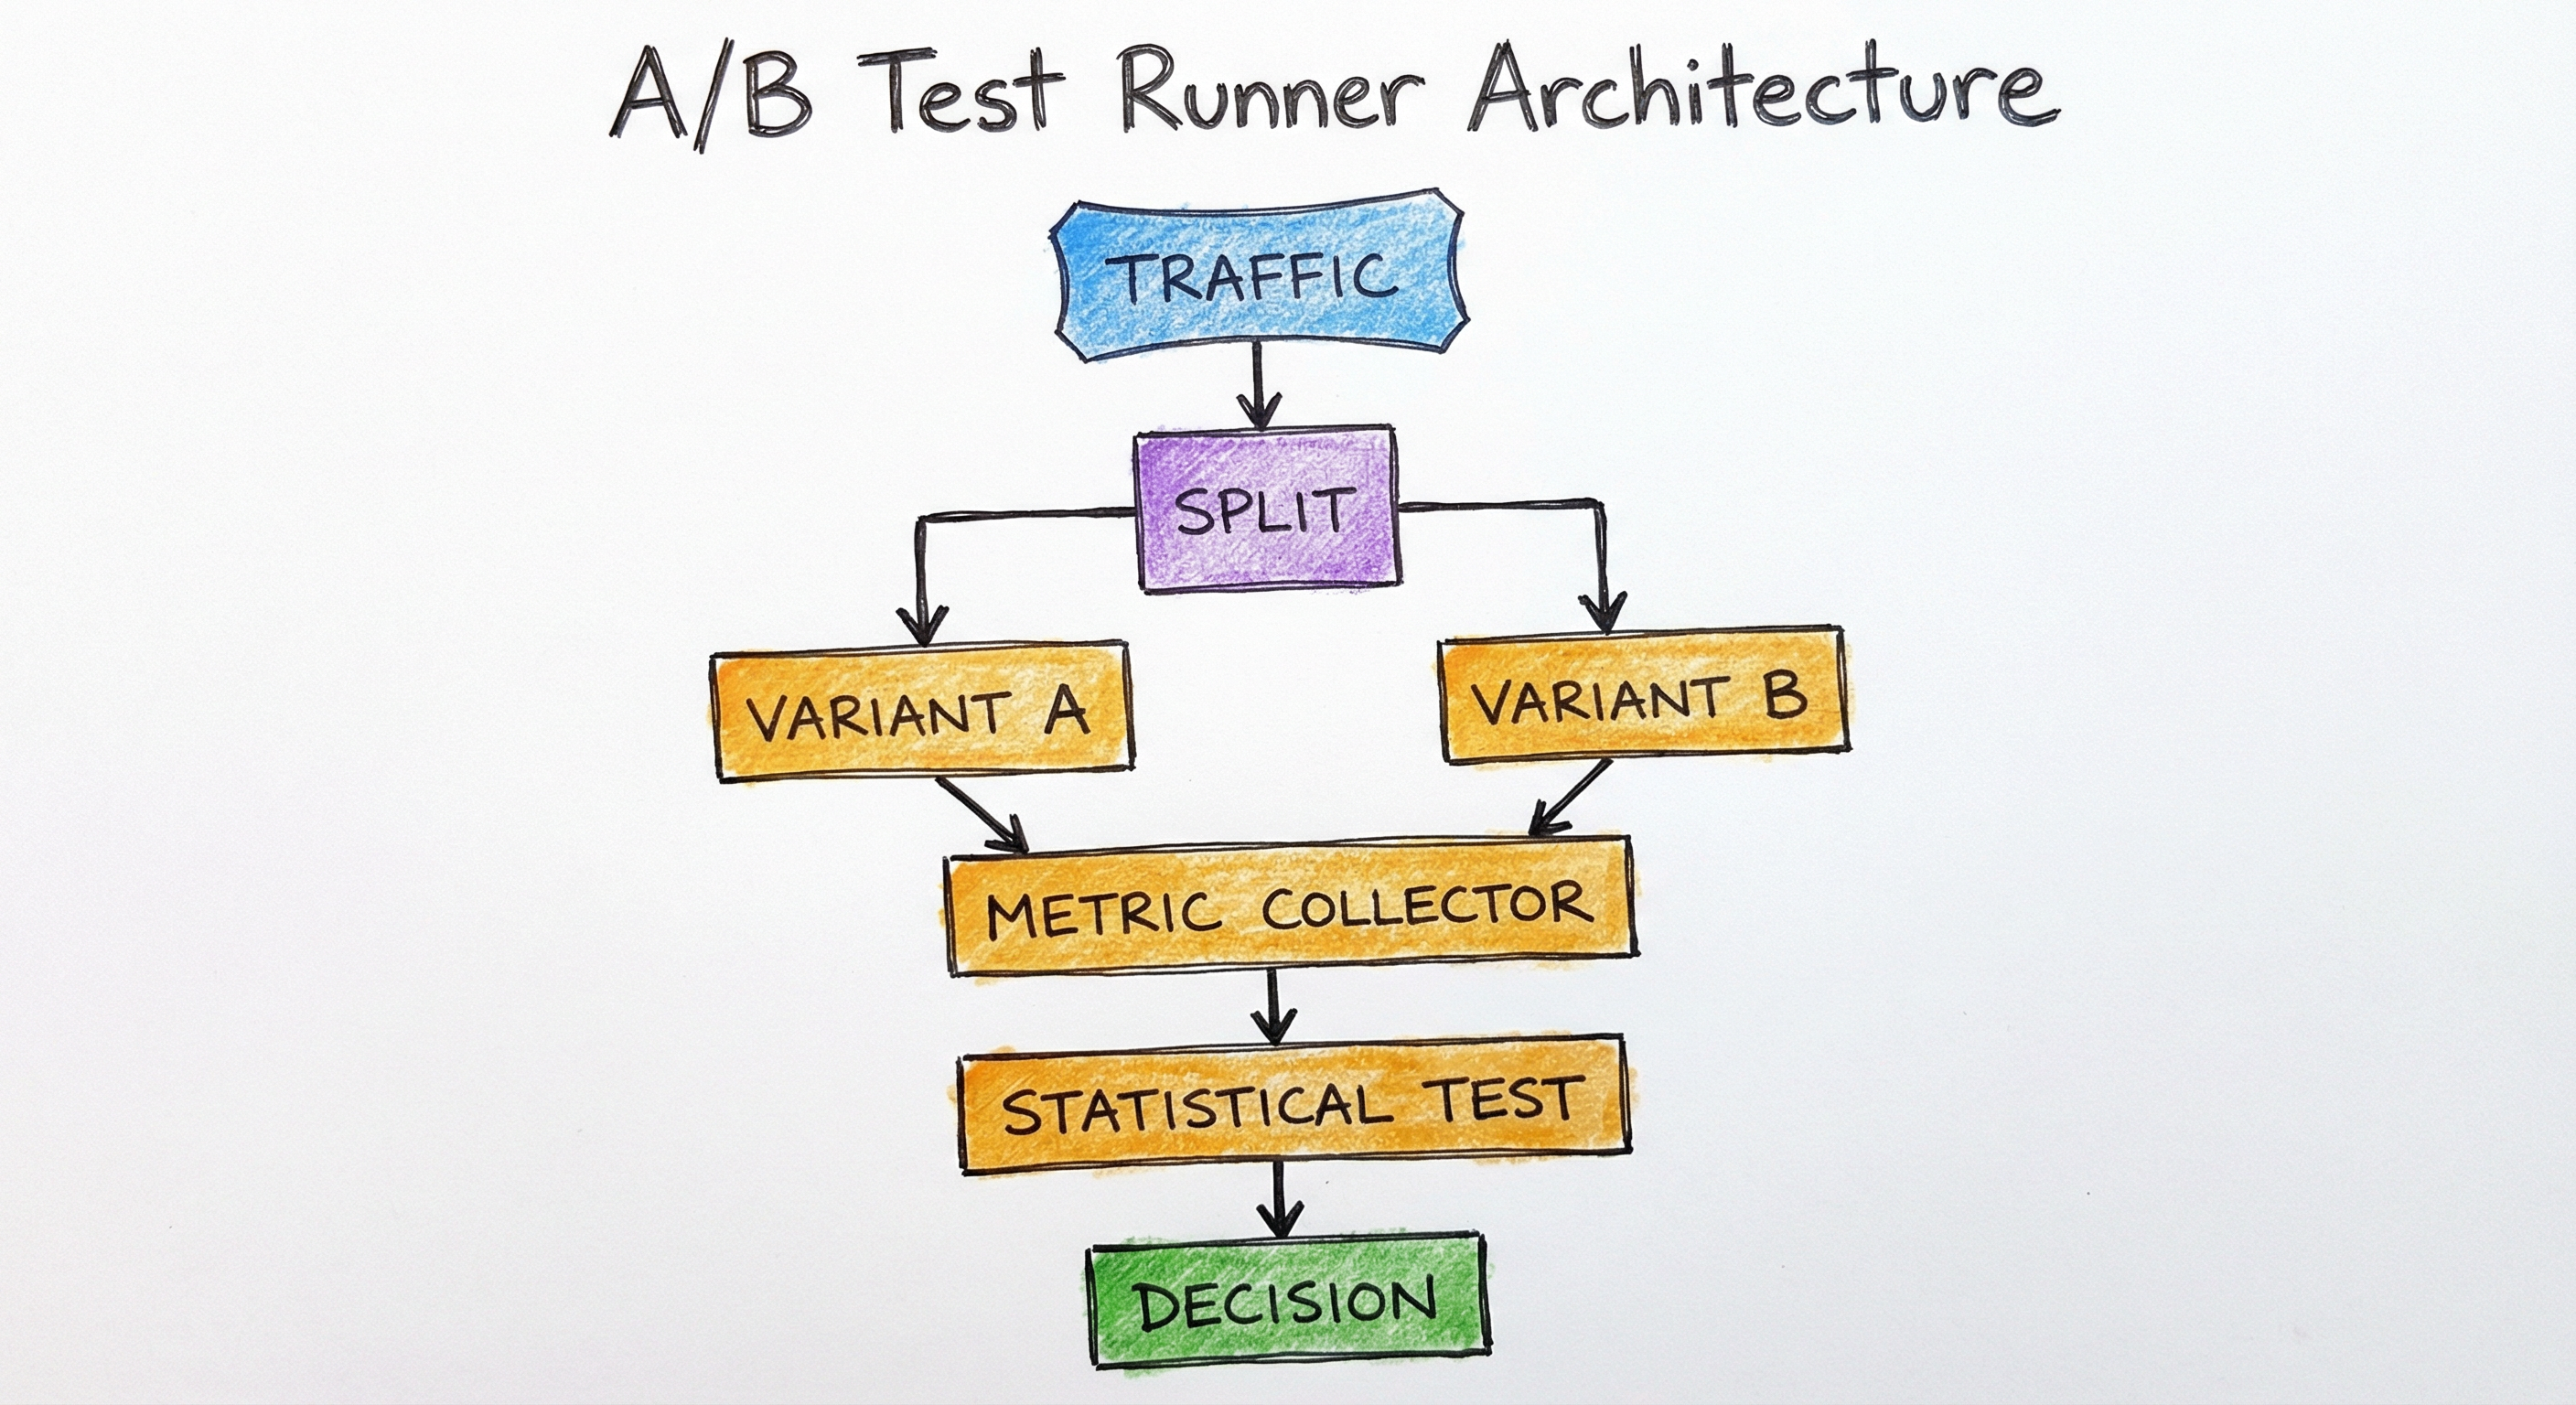
The architecture must handle three critical concerns: (1) deterministic, consistent assignment -- a user must always see the same variant across sessions and devices; (2) metric integrity -- collected metrics must be accurate, timely, and free from logging bugs; and (3) statistical rigor -- the analysis engine must correctly compute treatment effects, handle multiple comparisons, and support various testing methodologies (frequentist, Bayesian, sequential).
At scale, the randomization engine alone handles millions of QPS (queries per second). Uber's experimentation platform serves over 1,000 concurrent experiments, and they optimized their evaluation engine to be 100x faster by moving from remote RPC-based to local client-side evaluation. LinkedIn's Lix Engine is embedded in approximately 500 production services.
Key Components
Experiment Configuration Service
Defines the experiment parameters: hypothesis, variants (control/treatment), traffic allocation percentage, targeting rules (geo, platform, user segment), primary metric (Overall Evaluation Criterion or OEC), secondary metrics, guardrail metrics, expected MDE, and experiment duration. Stores experiment metadata and provides an API for experiment creation and management.
Randomization Engine
Assigns users to experiment variants using a deterministic hash function (typically MurmurHash or MD5 on user_id + experiment_id). This ensures consistent assignment: the same user always sees the same variant, regardless of when or how many times they are evaluated. Supports traffic layering so multiple independent experiments can run simultaneously without interference.
Feature Flag / Variant Delivery
Delivers the assigned variant to the application layer. For ML model experiments, this means routing the user's request to the appropriate model serving endpoint (Model A for control, Model B for treatment). Must have ultra-low latency (sub-millisecond) to avoid degrading user experience.
Metric Collection Pipeline
Collects outcome metrics from user interactions (clicks, conversions, revenue, latency, error rates). Uses event logging systems (Kafka, Kinesis) to stream events to a data warehouse. Must handle delayed conversions (e.g., a purchase that happens 7 days after initial exposure) and attribute events to the correct experiment variant.
Statistical Analysis Engine
Computes treatment effects, confidence intervals, and p-values (frequentist) or posterior probabilities (Bayesian). Supports CUPED for variance reduction, delta method for ratio metrics, bootstrap for non-standard metrics, and sequential testing for safe peeking. Handles multiple comparison correction (Bonferroni, Benjamini-Hochberg) when testing many metrics simultaneously.
Guardrail Monitoring
Continuously monitors guardrail metrics (latency, error rate, crash rate, revenue per user) that must not degrade regardless of primary metric outcome. If a guardrail metric crosses its threshold, the system triggers an automatic alert or experiment shutdown. This is the safety net that prevents shipping changes that improve one metric at the expense of critical system health.
Experiment Dashboard & Reporting
Visualizes experiment results in real-time or near-real-time. Shows metric time series, treatment effects with confidence intervals, sample sizes, segment-level breakdowns (by geography, platform, user cohort), and statistical significance status. Generates automated reports at experiment conclusion with go/no-go recommendations.
Data Flow
The end-to-end data flow of an A/B test follows these steps:
Step 1 -- Configuration: The experiment owner defines the hypothesis ("Model B will increase CTR by 5%"), selects metrics, sets traffic allocation (e.g., 50/50), and specifies guardrails.
Step 2 -- Randomization: When a user makes a request, the randomization engine hashes user_id + experiment_salt to produce a value in [0, 1). If the value falls in [0, 0.5), the user is assigned to control; [0.5, 1.0) to treatment. The salt ensures independence from other experiments.
Step 3 -- Variant Delivery: The application routes the user's request to the appropriate model endpoint. For an ML model swap, this is often as simple as changing the model version in the serving infrastructure.
Step 4 -- Metric Logging: User interactions (impressions, clicks, purchases, session duration, errors) are logged as events with the experiment variant tag. Events flow through a streaming pipeline to the data warehouse.
Step 5 -- Analysis: The statistical engine periodically (hourly or daily) computes metrics per variant, calculates treatment effects, and runs hypothesis tests. CUPED is applied using pre-experiment user behavior as the covariate.
Step 6 -- Decision: When the experiment reaches the predetermined sample size (or the sequential test crosses a boundary), the dashboard displays the final results. The experiment owner, guided by the analysis, makes a ship/no-ship decision.
Step 7 -- Ramp-up or Rollback: If the treatment wins, traffic is gradually ramped from 50% to 100%. If it loses or a guardrail is violated, traffic reverts to 100% control.
A directed flow from experiment configuration through randomization engine to user assignment (splitting into control and treatment paths), metric logging from both paths, data pipeline aggregation, statistical analysis engine, dashboard with alerts, and final go/no-go decision.
How to Implement
Building an A/B Test Runner
Implementing a production-grade A/B Test Runner involves three layers of complexity: (1) the randomization and variant assignment layer, (2) the metric computation and statistical analysis layer, and (3) the operational layer (dashboards, alerts, automated ramp-up/rollback).
For most teams, building from scratch is the wrong choice. Platforms like GrowthBook (open-source), Statsig, Optimizely, and LaunchDarkly provide all three layers out of the box. The ROI of building in-house only makes sense at the scale of Netflix, Uber, or LinkedIn (1,000+ concurrent experiments). For a startup running 5-20 experiments per quarter, a managed platform saves 6-12 months of engineering time.
However, understanding the implementation is essential for ML system design interviews and for making informed decisions about platform selection. Below are runnable code examples covering the core components.
Key Implementation Decisions
Randomization unit: Most experiments randomize at the user level, but some require session-level (for latency experiments), page-level (for layout changes), or cluster-level (for network effects in social products). The choice affects independence assumptions and variance estimation.
Traffic allocation: A 50/50 split maximizes statistical power but exposes 50% of users to an untested experience. Conservative teams start with 5-10% treatment, validate guardrails, then ramp up. This trades power for safety.
Analysis methodology: Frequentist (fixed-horizon or sequential) vs Bayesian. Frequentist is simpler and well-understood but requires pre-committed sample sizes. Bayesian allows continuous monitoring but requires prior specification. Most modern platforms support both.
Cost Note: Running an A/B test for an ML model serving 10M requests/day at a payment gateway like Razorpay involves negligible experimentation cost (the platform overhead is minimal). The real cost is opportunity cost: while 50% of traffic goes to a potentially inferior model, you are losing potential revenue. For a payment success rate improvement from 95% to 96% (1pp lift) with average transaction value of INR 2,000 and 5M daily transactions in treatment, the daily opportunity cost of the control group not getting the improvement is approximately INR 10 crore -- which is why fast, statistically sound experiments matter enormously.
import hashlib
from typing import Literal


def assign_variant(
    user_id: str,
    experiment_salt: str,
    treatment_fraction: float = 0.5,
) -> Literal["control", "treatment"]:
    """Deterministically assign a user to a variant using hashing.

    The hash ensures:
    1. Same user always gets the same variant (consistency)
    2. Assignment is independent across experiments (via salt)
    3. Distribution is uniform (hash output is pseudo-random)
    """
    hash_input = f"{user_id}:{experiment_salt}"
    hash_value = hashlib.md5(hash_input.encode()).hexdigest()
    # Convert first 8 hex chars to a float in [0, 1)
    bucket = int(hash_value[:8], 16) / 0xFFFFFFFF
    return "treatment" if bucket < treatment_fraction else "control"


# Example usage
users = ["user_001", "user_002", "user_003", "user_004", "user_005"]
experiment = "rec_model_v2_2026q1"

for uid in users:
    variant = assign_variant(uid, experiment)
    print(f"{uid} -> {variant}")

# Verify consistency: same user always gets the same variant
assert assign_variant("user_001", experiment) == assign_variant("user_001", experiment)

# Verify independence: different experiments assign differently
result_exp1 = assign_variant("user_001", "experiment_1")
result_exp2 = assign_variant("user_001", "experiment_2")
print(f"\nUser 001 in exp1: {result_exp1}, exp2: {result_exp2}")
This is the foundation of any A/B test runner. The deterministic hash ensures that a user always sees the same variant -- critical for consistent user experience and valid metric attribution. The experiment salt ensures that assignments in one experiment are independent of another, allowing multiple experiments to run simultaneously without interference. In production, this function runs in the hot path of every request, so it must be fast (MD5 hashing is sub-microsecond). Companies like LinkedIn embed this logic directly in their Lix Engine across 500+ services.
import math
from scipy import stats
from typing import Optional


def calculate_sample_size(
    baseline_rate: float,
    mde_relative: float,
    alpha: float = 0.05,
    power: float = 0.80,
    two_sided: bool = True,
) -> dict:
    """Calculate required sample size per group for a proportion test.

    Args:
        baseline_rate: Current conversion rate (e.g., 0.05 for 5%)
        mde_relative: Minimum detectable effect as relative lift (e.g., 0.10 for 10%)
        alpha: Significance level (Type I error rate)
        power: Statistical power (1 - Type II error rate)
        two_sided: Whether to use a two-sided test

    Returns:
        Dictionary with sample size and experiment parameters
    """
    # Calculate absolute MDE from relative lift
    mde_absolute = baseline_rate * mde_relative

    # Pooled variance for proportions
    p_control = baseline_rate
    p_treatment = baseline_rate + mde_absolute

    # Z-scores
    z_alpha = stats.norm.ppf(1 - alpha / (2 if two_sided else 1))
    z_beta = stats.norm.ppf(power)

    # Variance under null (pooled) and alternative
    var_null = 2 * p_control * (1 - p_control)
    var_alt = (p_control * (1 - p_control)) + (p_treatment * (1 - p_treatment))

    # Sample size per group
    n_per_group = ((z_alpha * math.sqrt(var_null) + z_beta * math.sqrt(var_alt))
                   / mde_absolute) ** 2
    n_per_group = math.ceil(n_per_group)

    return {
        "n_per_group": n_per_group,
        "n_total": n_per_group * 2,
        "baseline_rate": baseline_rate,
        "mde_relative": f"{mde_relative:.1%}",
        "mde_absolute": f"{mde_absolute:.4f}",
        "expected_treatment_rate": p_treatment,
        "alpha": alpha,
        "power": power,
    }


# Example 1: E-commerce conversion rate
result = calculate_sample_size(
    baseline_rate=0.032,     # 3.2% conversion rate
    mde_relative=0.10,       # Detect a 10% relative lift
    alpha=0.05,
    power=0.80,
)
print("E-commerce Conversion Test:")
print(f"  Need {result['n_per_group']:,} users per group")
print(f"  Total: {result['n_total']:,} users")
print(f"  Detecting: {result['baseline_rate']:.1%} -> {result['expected_treatment_rate']:.1%}")

# Example 2: CTR improvement for a recommendation model
result2 = calculate_sample_size(
    baseline_rate=0.12,      # 12% CTR
    mde_relative=0.05,       # Detect a 5% relative lift
    alpha=0.05,
    power=0.80,
)
print(f"\nRecommendation CTR Test:")
print(f"  Need {result2['n_per_group']:,} users per group")
print(f"  Total: {result2['n_total']:,} users")
This calculator answers the most critical pre-experiment question: how many users do you need? The answer depends on your baseline metric, the minimum effect you want to detect (MDE), and your tolerance for errors. Notice how a smaller MDE or higher power dramatically increases the required sample size. For a Flipkart-scale product with 100M monthly users, even a demanding experiment (small MDE, high power) is feasible. For a niche B2B SaaS with 5,000 MAU, you may need to accept larger MDEs or run experiments for months.
import numpy as np
from scipy import stats
from dataclasses import dataclass
from typing import Optional


@dataclass
class ABTestResult:
    control_mean: float
    treatment_mean: float
    absolute_lift: float
    relative_lift: float
    p_value: float
    confidence_interval: tuple
    is_significant: bool
    n_control: int
    n_treatment: int
    variance_reduction: Optional[float] = None


def analyze_ab_test(
    control: np.ndarray,
    treatment: np.ndarray,
    alpha: float = 0.05,
    pre_experiment_control: Optional[np.ndarray] = None,
    pre_experiment_treatment: Optional[np.ndarray] = None,
) -> ABTestResult:
    """Analyze an A/B test with optional CUPED variance reduction.

    Args:
        control: Metric values for the control group
        treatment: Metric values for the treatment group
        alpha: Significance level
        pre_experiment_control: Pre-experiment covariate for control (for CUPED)
        pre_experiment_treatment: Pre-experiment covariate for treatment (for CUPED)

    Returns:
        ABTestResult with statistical analysis
    """
    variance_reduction = None

    # Apply CUPED if pre-experiment data is provided
    if pre_experiment_control is not None and pre_experiment_treatment is not None:
        # Combine for theta estimation
        all_y = np.concatenate([control, treatment])
        all_x = np.concatenate([pre_experiment_control, pre_experiment_treatment])

        # Compute theta = Cov(Y, X) / Var(X)
        theta = np.cov(all_y, all_x)[0, 1] / np.var(all_x)

        # Adjust outcomes
        x_mean = np.mean(all_x)
        control_adj = control - theta * (pre_experiment_control - x_mean)
        treatment_adj = treatment - theta * (pre_experiment_treatment - x_mean)

        # Calculate variance reduction
        original_var = np.var(np.concatenate([control, treatment]))
        adjusted_var = np.var(np.concatenate([control_adj, treatment_adj]))
        variance_reduction = 1 - (adjusted_var / original_var)

        control = control_adj
        treatment = treatment_adj

    # Compute statistics
    n_c, n_t = len(control), len(treatment)
    mean_c, mean_t = np.mean(control), np.mean(treatment)
    var_c, var_t = np.var(control, ddof=1), np.var(treatment, ddof=1)

    # Standard error of the difference
    se = np.sqrt(var_c / n_c + var_t / n_t)

    # Z-statistic and p-value (two-sided)
    z_stat = (mean_t - mean_c) / se
    p_value = 2 * (1 - stats.norm.cdf(abs(z_stat)))

    # Confidence interval
    z_crit = stats.norm.ppf(1 - alpha / 2)
    ci_lower = (mean_t - mean_c) - z_crit * se
    ci_upper = (mean_t - mean_c) + z_crit * se

    return ABTestResult(
        control_mean=mean_c,
        treatment_mean=mean_t,
        absolute_lift=mean_t - mean_c,
        relative_lift=(mean_t - mean_c) / mean_c if mean_c != 0 else float('inf'),
        p_value=p_value,
        confidence_interval=(ci_lower, ci_upper),
        is_significant=p_value < alpha,
        n_control=n_c,
        n_treatment=n_t,
        variance_reduction=variance_reduction,
    )


# Simulate an A/B test for a recommendation model
np.random.seed(42)
n = 10000

# Pre-experiment behavior (e.g., last week's CTR per user)
pre_control = np.random.beta(2, 18, n)  # ~10% baseline
pre_treatment = np.random.beta(2, 18, n)

# Experiment outcomes (treatment has a 5% relative lift)
control_outcomes = pre_control + np.random.normal(0, 0.05, n)
treatment_outcomes = pre_treatment * 1.05 + np.random.normal(0, 0.05, n)

# Analyze without CUPED
result_raw = analyze_ab_test(control_outcomes, treatment_outcomes)
print("Without CUPED:")
print(f"  Lift: {result_raw.relative_lift:.2%}")
print(f"  P-value: {result_raw.p_value:.4f}")
print(f"  Significant: {result_raw.is_significant}")

# Analyze with CUPED
result_cuped = analyze_ab_test(
    control_outcomes, treatment_outcomes,
    pre_experiment_control=pre_control,
    pre_experiment_treatment=pre_treatment,
)
print(f"\nWith CUPED:")
print(f"  Lift: {result_cuped.relative_lift:.2%}")
print(f"  P-value: {result_cuped.p_value:.6f}")
print(f"  Significant: {result_cuped.is_significant}")
print(f"  Variance Reduction: {result_cuped.variance_reduction:.1%}")
This example demonstrates a complete A/B test analysis pipeline with CUPED variance reduction. CUPED uses pre-experiment user behavior (e.g., last week's CTR) as a covariate to reduce noise in the treatment effect estimate. In practice, CUPED typically achieves 20-50% variance reduction, which is equivalent to having 25-100% more data for free. This is why every major experimentation platform (Statsig, Optimizely, Netflix's XP) implements CUPED. The code shows how CUPED can turn a non-significant result into a significant one by reducing noise, not by manufacturing signal.
import numpy as np
from scipy import stats


def bayesian_ab_test(
    control_successes: int,
    control_trials: int,
    treatment_successes: int,
    treatment_trials: int,
    prior_alpha: float = 1.0,
    prior_beta: float = 1.0,
    n_simulations: int = 100000,
) -> dict:
    """Bayesian A/B test for binary outcomes using Beta-Binomial model.

    Uses conjugate Beta prior: Beta(alpha, beta) with Binomial likelihood
    gives Beta(alpha + successes, beta + failures) posterior.

    Args:
        control_successes: Number of conversions in control
        control_trials: Total users in control
        treatment_successes: Number of conversions in treatment
        treatment_trials: Total users in treatment
        prior_alpha: Beta prior alpha (1.0 = uniform/non-informative)
        prior_beta: Beta prior beta (1.0 = uniform/non-informative)
        n_simulations: Number of Monte Carlo samples

    Returns:
        Dictionary with posterior statistics and decision metrics
    """
    # Posterior parameters (conjugate update)
    control_a = prior_alpha + control_successes
    control_b = prior_beta + (control_trials - control_successes)
    treatment_a = prior_alpha + treatment_successes
    treatment_b = prior_beta + (treatment_trials - treatment_successes)

    # Sample from posteriors
    control_samples = np.random.beta(control_a, control_b, n_simulations)
    treatment_samples = np.random.beta(treatment_a, treatment_b, n_simulations)

    # Probability that treatment is better
    prob_treatment_better = np.mean(treatment_samples > control_samples)

    # Expected lift distribution
    lift_samples = (treatment_samples - control_samples) / control_samples

    # Risk: expected loss if we choose treatment but it's actually worse
    loss_if_choose_treatment = np.mean(
        np.maximum(control_samples - treatment_samples, 0)
    )
    loss_if_choose_control = np.mean(
        np.maximum(treatment_samples - control_samples, 0)
    )

    return {
        "prob_treatment_better": prob_treatment_better,
        "expected_lift": np.mean(lift_samples),
        "lift_95_ci": (np.percentile(lift_samples, 2.5), np.percentile(lift_samples, 97.5)),
        "control_posterior_mean": control_a / (control_a + control_b),
        "treatment_posterior_mean": treatment_a / (treatment_a + treatment_b),
        "risk_choosing_treatment": loss_if_choose_treatment,
        "risk_choosing_control": loss_if_choose_control,
        "recommended_action": "Ship treatment" if prob_treatment_better > 0.95 else
                               "Ship control" if prob_treatment_better < 0.05 else
                               "Continue experiment",
    }


# Example: Testing a new ML-based search ranking at an Indian e-commerce platform
np.random.seed(42)

result = bayesian_ab_test(
    control_successes=3200,    # 3200 conversions out of 100k
    control_trials=100000,
    treatment_successes=3350,  # 3350 conversions out of 100k
    treatment_trials=100000,
)

print("Bayesian A/B Test Results:")
print(f"  Control conversion rate:   {result['control_posterior_mean']:.3%}")
print(f"  Treatment conversion rate: {result['treatment_posterior_mean']:.3%}")
print(f"  P(treatment > control):    {result['prob_treatment_better']:.1%}")
print(f"  Expected relative lift:    {result['expected_lift']:.2%}")
print(f"  95% CI for lift:           [{result['lift_95_ci'][0]:.2%}, {result['lift_95_ci'][1]:.2%}]")
print(f"  Risk if ship treatment:    {result['risk_choosing_treatment']:.5f}")
print(f"  Risk if ship control:      {result['risk_choosing_control']:.5f}")
print(f"  Recommendation:            {result['recommended_action']}")
Bayesian A/B testing has a major practical advantage: you can check results at any time without inflating false positive rates. The posterior probability P(treatment > control) is always valid, unlike a frequentist p-value which is only valid at the pre-committed sample size. This is why platforms like GrowthBook use Bayesian analysis as their default. The risk metric (expected loss if you make the wrong decision) is particularly useful for business decisions: if the risk of shipping treatment is 0.0001 (0.01 percentage points of conversion), you might ship even if P(better) is only 90% because the downside is negligible. This example models a search ranking experiment at an Indian e-commerce platform with 200K total users.
import numpy as np
from typing import List
from dataclasses import dataclass, field


@dataclass
class BanditArm:
    name: str
    alpha: float = 1.0  # Beta prior successes
    beta: float = 1.0   # Beta prior failures
    total_pulls: int = 0
    total_rewards: int = 0

    def update(self, reward: int):
        self.alpha += reward
        self.beta += (1 - reward)
        self.total_pulls += 1
        self.total_rewards += reward

    def sample(self) -> float:
        return np.random.beta(self.alpha, self.beta)

    @property
    def conversion_rate(self) -> float:
        if self.total_pulls == 0:
            return 0.0
        return self.total_rewards / self.total_pulls


def run_thompson_sampling(
    true_rates: List[float],
    arm_names: List[str],
    n_rounds: int = 10000,
) -> dict:
    """Run Thompson Sampling multi-armed bandit.

    Thompson Sampling is a Bayesian approach that balances
    exploration (trying uncertain arms) and exploitation
    (choosing the best-known arm) naturally through posterior
    sampling.
    """
    arms = [BanditArm(name=name) for name in arm_names]
    cumulative_regret = []
    total_regret = 0
    best_rate = max(true_rates)

    for round_num in range(n_rounds):
        # Sample from each arm's posterior and pick the highest
        samples = [arm.sample() for arm in arms]
        chosen_idx = np.argmax(samples)

        # Simulate reward from the true (unknown) conversion rate
        reward = np.random.binomial(1, true_rates[chosen_idx])
        arms[chosen_idx].update(reward)

        # Track regret (difference from always choosing the best arm)
        total_regret += best_rate - true_rates[chosen_idx]
        cumulative_regret.append(total_regret)

    return {
        "arms": [
            {
                "name": arm.name,
                "pulls": arm.total_pulls,
                "observed_rate": f"{arm.conversion_rate:.3%}",
                "traffic_share": f"{arm.total_pulls / n_rounds:.1%}",
            }
            for arm in arms
        ],
        "total_regret": total_regret,
        "avg_regret_per_round": total_regret / n_rounds,
    }


# Example: Testing 3 recommendation models simultaneously
np.random.seed(42)
result = run_thompson_sampling(
    true_rates=[0.10, 0.12, 0.11],  # True CTRs (unknown to the algorithm)
    arm_names=["Model A (baseline)", "Model B (new)", "Model C (experimental)"],
    n_rounds=10000,
)

print("Thompson Sampling Results (10,000 rounds):")
print(f"{'Arm':<30} {'Pulls':>8} {'Rate':>10} {'Traffic':>10}")
print("-" * 60)
for arm in result["arms"]:
    print(f"{arm['name']:<30} {arm['pulls']:>8} {arm['observed_rate']:>10} {arm['traffic_share']:>10}")
print(f"\nTotal regret: {result['total_regret']:.1f}")
print(f"Avg regret/round: {result['avg_regret_per_round']:.4f}")
Multi-armed bandits (MAB) are an alternative to traditional A/B testing that dynamically allocate more traffic to better-performing variants during the experiment. Thompson Sampling is the most popular MAB algorithm because it naturally balances exploration (trying uncertain options) and exploitation (favoring the best-known option). Notice how the best arm (Model B at 12% CTR) gets the most traffic while the algorithm still explores others. The tradeoff: MAB minimizes regret during the experiment (fewer users see the inferior variant) but provides weaker statistical guarantees about the treatment effect. Use MAB for optimization-focused scenarios (which ad to show) and traditional A/B tests for inference-focused scenarios (does this model improve CTR?).
# GrowthBook experiment configuration (YAML)
experiment:
  id: rec-model-v2-2026q1
  name: Recommendation Model V2 Test
  hypothesis: >-
    The new collaborative filtering model (V2) will increase
    add-to-cart rate by at least 5% relative to the current
    content-based model (V1).

  # Traffic allocation
  allocation:
    control: 0.50     # 50% traffic
    treatment: 0.50   # 50% traffic

  # Targeting
  targeting:
    platforms: [web, android, ios]
    countries: [IN, US, UK]
    user_segments: [returning_users]

  # Metrics
  metrics:
    primary:
      - name: add_to_cart_rate
        type: proportion
        direction: increase
    secondary:
      - name: revenue_per_user
        type: mean
        direction: increase
      - name: items_viewed
        type: mean
        direction: increase
    guardrails:
      - name: p99_latency_ms
        threshold: 500
        direction: must_not_increase
      - name: error_rate
        threshold: 0.01
        direction: must_not_increase
      - name: crash_rate
        threshold: 0.001
        direction: must_not_increase

  # Analysis settings
  analysis:
    method: frequentist_sequential  # or: bayesian, frequentist_fixed
    alpha: 0.05
    power: 0.80
    mde_relative: 0.05              # 5% relative lift
    variance_reduction: cuped
    cuped_covariate: pre_experiment_add_to_cart_rate
    multiple_comparison_correction: benjamini_hochberg

  # Duration
  schedule:
    start_date: 2026-03-01
    min_runtime_days: 14
    max_runtime_days: 42
    estimated_sample_size_per_group: 50000
Common Implementation Mistakes
- ●
Peeking at results before the predetermined sample size is reached: This is the most pervasive mistake. Checking your p-value daily and stopping when it drops below 0.05 inflates your actual false positive rate from 5% to as high as 26%. Use sequential testing (always-valid p-values) or Bayesian methods if you need to monitor continuously.
- ●
Using a 90/10 traffic split to 'be safe' without adjusting sample size expectations: Unequal splits reduce statistical power dramatically. A 90/10 split requires 68% more total traffic than a 50/50 split to achieve the same power. If you are concerned about the treatment hurting users, use a ramp-up strategy or guardrail metrics instead.
- ●
Ignoring the multiple comparisons problem: Testing 20 metrics simultaneously with alpha = 0.05 means you expect 1 false positive by chance. Apply Bonferroni correction (alpha/20 per test) or Benjamini-Hochberg FDR control. Better yet, pre-register a single primary metric (OEC) and treat all others as exploratory.
- ●
Not running an A/A test first: Before running your first A/B test on a new platform, run an A/A test (same experience for both groups). If you see statistically significant differences, your randomization or metric pipeline is broken. This catches implementation bugs that would invalidate all subsequent experiments.
- ●
Confusing statistical significance with practical significance: A p-value of 0.001 for a 0.01% lift in conversion is statistically significant but practically worthless. Always evaluate whether the observed effect size justifies the engineering cost of deployment. Define your MDE upfront to focus on practically meaningful effects.
- ●
Running experiments too short to capture delayed conversions: If your conversion window is 7 days (user clicks today, purchases next week), running the experiment for only 3 days will systematically undercount treatment conversions. Always run experiments for at least one full conversion cycle plus the observation window.
- ●
Ignoring novelty and primacy effects: Users may engage more with a new experience simply because it is new (novelty effect) or less because it disrupts their habits (primacy effect). Both effects decay over time. Run experiments for at least 2-4 weeks to allow these effects to stabilize before making a decision.
When Should You Use This?
Use When
You need to measure the causal impact of a new ML model on business metrics, not just offline proxy metrics like AUC or NDCG
You have enough traffic to reach statistical significance within a reasonable timeframe (typically 2-6 weeks for web-scale products)
The change affects a well-defined user population and you can randomize at the appropriate unit (user, session, device)
You need to validate that offline improvements actually translate to online gains before a full production rollout
Multiple stakeholders disagree about whether to ship a change, and you need an objective, data-driven resolution
You are introducing a new ML model that changes user-facing behavior (recommendations, search ranking, pricing, content personalization) and need to quantify the risk
Guardrail metrics (latency, error rates, revenue) must be monitored alongside the primary metric to ensure the change is safe
Avoid When
You have very low traffic (fewer than 1,000 daily active users) and cannot reach statistical significance within a practical timeframe -- consider pre/post analysis or synthetic control methods instead
The change has no user-facing impact (e.g., backend refactoring, code cleanup) and can be validated through monitoring and rollback alone
The change is a critical bug fix or security patch where delaying deployment for experimentation introduces unacceptable risk
Strong network effects make randomization invalid (e.g., changing the recommendation algorithm for sellers on a marketplace also affects buyers who are in the control group). Use switchback or cluster-randomized designs instead
You are testing a one-time event or campaign (e.g., a Diwali sale banner) where there is no stable baseline and no opportunity to replicate
Ethical constraints prevent randomization -- e.g., withholding a clearly beneficial treatment from the control group in a medical or financial context
The metric you care about has extremely high variance relative to the expected effect, making the required sample size impractically large even with variance reduction techniques
Key Tradeoffs
Statistical Power vs Experiment Duration
The fundamental tradeoff in A/B testing is between sensitivity (ability to detect small effects) and speed (time to reach a decision). Detecting a 1% relative lift requires ~16x more samples than detecting a 4% relative lift. For a platform like Flipkart with 300M+ monthly users, a 1% MDE experiment finishes in days. For a niche SaaS with 10,000 MAU, even a 10% MDE experiment might take months.
CUPED and other variance reduction techniques partially break this tradeoff by effectively increasing your sample size for free. A 40% variance reduction via CUPED is equivalent to having 67% more users -- potentially cutting experiment duration from 4 weeks to 2.5 weeks.
Frequentist vs Bayesian Analysis
| Aspect | Frequentist | Bayesian |
|---|---|---|
| Peeking | Prohibited (inflates false positives) | Safe (posterior is always valid) |
| Decision criterion | p-value < alpha | P(treatment better) > threshold |
| Sample size | Must be pre-committed | Flexible, no fixed horizon |
| Interpretation | "How surprising is this data if H0 is true?" | "What is the probability that treatment is better?" |
| Complexity | Simpler to implement | Requires prior specification |
| Industry adoption | LinkedIn, Microsoft, Uber | GrowthBook, Optimizely, Netflix |
In practice, sequential frequentist tests (always-valid p-values) provide the best of both worlds: frequentist error guarantees with the ability to peek safely.
A/B Test vs Multi-Armed Bandit
| Aspect | A/B Test | Multi-Armed Bandit |
|---|---|---|
| Goal | Inference ("Is B better than A?") | Optimization ("Maximize total reward") |
| Traffic split | Fixed (50/50 or pre-set) | Adaptive (shifts toward winner) |
| Regret during test | Higher (50% on potentially inferior) | Lower (traffic shifts to winner) |
| Statistical inference | Strong (valid p-values, CIs) | Weak (biased effect estimates) |
| Best for | Model evaluation, long-term decisions | Short-term optimization, many variants |
Use A/B tests when you need to understand the treatment effect ("our new model increases conversion by 3.2% +/- 0.8%"). Use bandits when you need to maximize reward during the test ("show the best ad variant to the most users").
Rule of Thumb: If the decision is irreversible or high-stakes (shipping a new recommendation engine that affects millions of users), use a proper A/B test with pre-registered hypothesis and pre-committed sample size. If the decision is reversible and low-stakes (which of 5 banner images to show), use a bandit.
Alternatives & Comparisons
The statistical significance block is a downstream component of the A/B Test Runner. While the A/B Test Runner orchestrates the full experiment lifecycle (randomization, traffic splitting, metric collection, guardrails), the statistical significance calculator focuses specifically on the analysis step: computing p-values, confidence intervals, and determining whether observed differences are statistically significant. Use the A/B Test Runner when you need end-to-end experiment management; use the significance calculator for post-hoc analysis of collected data.
Uplift models (also called heterogeneous treatment effect models) predict the individual-level treatment effect, while A/B tests estimate the average treatment effect (ATE) across the population. Use an A/B test when you want to know 'does this model help on average?' Use uplift models when you want to know 'which users benefit most from this model?' Uplift models require A/B test data for training (they learn from the randomized experiment), so the two are complementary rather than substitutes.
Canary deployment gradually rolls out a change to a small percentage of traffic while monitoring for regressions. Unlike A/B testing, canary deployments do not randomize users and do not provide causal effect estimates. A canary catches catastrophic failures (crashes, errors, severe latency degradation) but cannot tell you whether the new model improves CTR by 2%. Use canary deployment as a safety gate before the A/B test, not as a substitute for it.
Drift detection monitors for distribution shifts in model inputs or predictions over time. While an A/B test compares two models at a point in time, drift detection monitors one model over time. They serve different purposes: A/B testing answers 'is the new model better?' while drift detection answers 'has the deployed model degraded?' Use both in a mature ML system: A/B test for model selection, drift detection for ongoing monitoring.
Pros, Cons & Tradeoffs
Advantages
Establishes causation, not just correlation: Randomization eliminates confounders, allowing you to attribute observed metric changes directly to the model change. This is the only reliable method for measuring causal impact in production.
Catches offline-online disconnects: Offline metrics (AUC, NDCG, F1) are imperfect proxies. A/B tests measure what actually matters -- user behavior and business outcomes. Models that look great offline can underperform online due to latency, feedback loops, or user behavior changes.
Quantifies effect sizes with confidence intervals: Unlike binary ship/no-ship decisions, A/B tests provide effect estimates with uncertainty bounds (e.g., '2.3% lift, 95% CI [1.1%, 3.5%]'). This enables informed cost-benefit analysis for deployment decisions.
Guardrail metrics prevent regressions: The guardrail framework ensures that improvements on the primary metric do not come at the expense of critical system health metrics (latency, error rate, revenue). This safety net is invaluable for complex ML systems with many downstream dependencies.
Builds organizational discipline around evidence-based decisions: A/B testing culture prevents HiPPO (Highest Paid Person's Opinion) decision-making. When every change must prove its worth through data, product quality improves systematically.
Scalable and repeatable: Once the experimentation platform is set up, running additional experiments is cheap. Teams can test dozens of model variants, feature combinations, and parameter settings in parallel with minimal engineering overhead.
Disadvantages
Requires substantial traffic for statistical power: Detecting a 2% relative lift on a 5% conversion rate requires ~60,000 users per group. For low-traffic products or rare events, reaching significance can take months, making rapid iteration impossible.
Cannot detect long-term effects within typical experiment windows: An ML model that improves retention over 6 months but shows no effect in a 4-week test will be incorrectly rejected. Long-term holdout groups and observational methods are needed to complement short-term A/B tests.
Network effects and spillover invalidate standard analysis: On platforms with user-to-user interactions (marketplaces, social networks), treating one user affects others, violating the Stable Unit Treatment Value Assumption (SUTVA). Specialized designs (cluster randomization, switchback) are needed but add complexity.
Opportunity cost during the experiment: While 50% of traffic serves the control (potentially inferior) variant, you are losing potential value. For high-revenue products (e.g., a payment gateway processing INR 1,000 crore/day), even a short experiment has significant opportunity cost.
Organizational overhead and process bottlenecks: Setting up proper experimentation requires infrastructure investment (platform, pipelines, dashboards), process definition (experiment review boards, launch criteria), and cultural change. Small teams may find this overhead disproportionate to their experimentation volume.
Prone to misuse and misinterpretation: Peeking, multiple comparisons, cherry-picking metrics, post-hoc hypotheses, and underpowered tests are rampant even in sophisticated organizations. Without proper tooling and training, A/B testing can give a false sense of scientific rigor.
Failure Modes & Debugging
Peeking and Early Stopping (Inflated False Positives)
Cause
The experiment owner checks p-values daily and stops the experiment as soon as p < 0.05, before reaching the pre-committed sample size. With repeated checking at each new data point, the cumulative false positive rate can reach 26% instead of the intended 5%.
Symptoms
Apparent winners that fail to replicate when re-tested. Deployed models show no improvement in post-launch monitoring. Teams report a suspiciously high success rate for experiments ("everything we test wins!"). Effect sizes shrink dramatically when experiments are run longer.
Mitigation
Use sequential testing (always-valid p-values via mSPRT) that controls type I error under continuous monitoring. Alternatively, use Bayesian analysis where the posterior probability is always valid. If using fixed-horizon frequentist tests, lock the dashboard until the pre-committed sample size is reached. Platforms like Statsig and GrowthBook implement these safeguards natively.
Sample Ratio Mismatch (SRM)
Cause
The observed ratio of control to treatment users deviates significantly from the expected ratio (e.g., 51.3% vs 48.7% when expecting 50/50). This indicates a bug in the randomization, logging, or filtering pipeline. Common causes: treatment variant crashes and users retry (counted in control), bot traffic disproportionately hits one variant, or redirect-based assignment has differential drop-off.
Symptoms
Chi-squared test on the sample ratio rejects the null hypothesis of equal assignment. Experiment results are unreliable regardless of metric differences. One variant has systematically different user characteristics (age, device, geography) despite randomization.
Mitigation
Run an SRM check before analyzing any experiment. If the chi-squared p-value for the sample ratio is below 0.001, the experiment is compromised. Debug the root cause (logging discrepancies, bot filtering, client-side assignment failures). Always run an A/A test on a new experimentation platform to verify randomization integrity before running real experiments.
Underpowered Experiment (Type II Errors)
Cause
The experiment runs with insufficient sample size to detect the true treatment effect. This happens when the MDE is set too aggressively (trying to detect a 1% lift with 10,000 users), the experiment is terminated prematurely, or metric variance is underestimated during planning.
Symptoms
Experiment concludes with 'no significant difference' even though the point estimate shows a meaningful lift. Confidence intervals are very wide, spanning both positive and negative territory. The team incorrectly concludes that the new model is no better than the incumbent.
Mitigation
Run a power analysis before starting the experiment. Use CUPED or other variance reduction techniques to boost effective sample size. If traffic is limited, increase MDE (accept detecting only larger effects), reduce the number of metrics tested, or extend experiment duration. Consider Bayesian analysis which provides useful posterior information even with limited data.
Simpson's Paradox in Segment Analysis
Cause
The overall treatment effect is positive, but when broken down by segment (e.g., mobile vs desktop), both segments show negative effects -- or vice versa. This happens when the treatment changes the composition of segments (e.g., the new model attracts more mobile users, who have lower baseline conversion).
Symptoms
Contradictory results between the overall analysis and segment-level analysis. Stakeholders lose trust in experiment results. The deployed change shows different effects than expected because the production traffic composition differs from the experiment.
Mitigation
Pre-register segment analyses and use proper segment-level randomization checks. Analyze segments that are defined pre-treatment (not post-treatment) to avoid composition bias. When segment effects contradict the overall effect, investigate whether the treatment changes segment composition before drawing conclusions.
Interference and Network Effects (SUTVA Violation)
Cause
On platforms with user interactions (social networks, marketplaces, ride-sharing), treating one user affects untreated users. For example, if a new pricing algorithm gives treatment riders lower fares, control riders in the same area experience longer wait times because drivers are diverted.
Symptoms
A/B test shows a positive treatment effect, but when the change is rolled out to 100%, the observed improvement is much smaller (diluted by interference). Or the A/B test shows no effect because the treatment and control groups contaminate each other.
Mitigation
Use cluster-randomized designs (randomize at the city or region level, not user level) or switchback experiments (alternate between treatment and control over time windows). For marketplace experiments, use two-sided randomization. Adjust variance estimates to account for within-cluster correlation (design effect).
Novelty and Primacy Effects Distorting Results
Cause
Users in the treatment group engage differently with the new experience not because it is objectively better or worse, but because it is unfamiliar. Novelty effect: increased engagement because the experience is new and exciting. Primacy effect: decreased engagement because users prefer the familiar experience.
Symptoms
Strong positive (or negative) treatment effect in the first week that diminishes over time. Effect size changes significantly when comparing week 1 vs week 3 of the experiment. Results do not replicate in a follow-up experiment run after the novelty has worn off.
Mitigation
Run experiments for at least 2-4 weeks to allow novelty/primacy effects to decay. Analyze treatment effects over time (look for convergence). Use a 'new user' segment (users who have never seen the old experience) as a novelty-free estimate. Consider holdout groups for long-term impact measurement.
Placement in an ML System
Where Does the A/B Test Runner Fit in the ML Pipeline?
The A/B Test Runner sits at the final validation gate between model development and full production deployment. Here is the typical workflow:
Phase 1 -- Offline Evaluation: Train Model B, evaluate on test data using metrics like AUC, F1, NDCG. If offline metrics improve over Model A (the incumbent), proceed.
Phase 2 -- Shadow Mode: Deploy Model B alongside Model A, running inference on the same requests but only serving Model A's predictions. Compare predictions and latency. Catch catastrophic issues (crashes, extreme latency, degenerate outputs).
Phase 3 -- Canary Deployment: Route 1-5% of traffic to Model B. Monitor guardrail metrics (error rate, latency, crash rate) for regressions. This is a safety check, not a scientific experiment.
Phase 4 -- A/B Test: Ramp up to 50/50 traffic split between Model A (control) and Model B (treatment). Run for the pre-determined duration (2-6 weeks). The A/B Test Runner manages randomization, metric collection, and statistical analysis.
Phase 5 -- Decision and Rollout: If the treatment wins on the primary metric without violating guardrails, gradually ramp to 100%. If it loses or is neutral, roll back to 100% control.
Phase 6 -- Long-term Holdout: Maintain a small holdout group (1-5%) on the old model for 3-6 months to validate long-term effects that short A/B tests might miss.
Key Insight: The A/B Test Runner is not an isolated block. It integrates with model serving (for variant routing), the metric collection pipeline (for outcome measurement), the alerting system (for guardrail violations), and the deployment system (for ramp-up/rollback). Designing this integration correctly is often harder than the statistical analysis itself.
Pipeline Stage
Evaluation / Online Validation
Upstream
- model-serving
- canary-deploy
- load-balancer
- roc-auc
- precision-recall-f1
Downstream
- statistical-significance
- uplift-model
- ctr-metric
- metrics-collector
- alerting
Scaling Bottlenecks
The A/B Test Runner itself is rarely the computational bottleneck -- the randomization hash is sub-microsecond and the statistical analysis runs on aggregated data. The bottlenecks are organizational and infrastructural:
1. Experiment Interaction Effects: When 1,000+ experiments run concurrently (as at Booking.com), experiments can interact. User X might be in 15 experiments simultaneously, and the combination of treatments might have unexpected effects. Solution: Traffic layering (orthogonal assignment) ensures experiments are statistically independent. Each experiment operates on its own "layer" of the hash space.
2. Metric Computation at Scale: Computing daily metrics for 1,000 experiments across 100M users with 50 metrics each = 50 billion metric computations per day. This is a serious data engineering challenge. Solution: LinkedIn made their experimentation engine 20x faster through incremental computation and pre-aggregation. Uber achieved 100x speedup by moving from remote evaluation to local client-side evaluation.
3. Organizational Bottleneck: As experimentation scales, the bottleneck shifts from infrastructure to process: experiment review boards, metric standardization, launch criteria, and result interpretation training. Companies like Booking.com solve this by democratizing experimentation -- everyone can run experiments, but guardrails are automated.
4. Small Effect Detection: As products mature, the low-hanging fruit is picked. Improvements shrink from 10% to 1% to 0.1%. Detecting a 0.1% lift requires ~100x more traffic than a 1% lift. CUPED variance reduction and stratified sampling partially mitigate this, but there are fundamental limits imposed by the central limit theorem.
Cost Estimate: Running a self-hosted experimentation platform (Kafka pipeline, Spark analytics, dashboard) costs approximately INR 50-80 lakh/year (USD 60-100K) in cloud infrastructure for a medium-scale operation (10M users, 50 concurrent experiments). Managed platforms like Statsig or GrowthBook Pro cost INR 15-40 lakh/year (USD 20-50K) for equivalent scale.
Production Case Studies
Netflix's experimentation platform is one of the most sophisticated in the industry. Every product change -- from the title artwork you see to the personalization algorithm that ranks your homepage to the video encoding pipeline -- goes through an A/B test before becoming the default experience. Netflix runs concurrent experiments across UI, algorithms, messaging, marketing, operations, and infrastructure. A single user can be in multiple experiments simultaneously (e.g., a title artwork test, a personalization algorithm test, and a video encoding test). The platform supports automated analysis, sequential testing for safe peeking, and multi-metric evaluation with guardrails.
Netflix attributes much of its growth and retention to experimentation-driven product development. Their personalization system alone is estimated to save the company over $1 billion per year by reducing subscriber churn. The experimentation platform enables hundreds of engineering teams to validate changes independently, with automated statistical analysis replacing manual interpretation.
Booking.com runs approximately 1,000 concurrent experiments at any given time, making it one of the most experimentation-intensive companies globally. Their platform is maintained by a centralized experimentation team, and tests can be deployed across 75 countries and 43 languages in under an hour. Experimentation is fully democratized: every employee can set up and run an experiment. They even run meta-experiments -- experiments on their experimentation methodology itself -- to validate that their statistical methods are correct. This includes testing their CUPED implementation, sequential testing boundaries, and metric computation pipelines.
Booking.com's experimentation culture is credited as a core driver of its growth from a small Dutch startup to one of the world's largest travel platforms. Most product changes have no measurable impact (the vast majority of tests are neutral), validating the necessity of A/B testing as a filter against shipping ineffective changes.
Uber's experimentation platform supports over 1,000 concurrent experiments across their rides, delivery, freight, and financial products. Their platform handles unique challenges including two-sided marketplace effects (changes to rider experience affect drivers and vice versa), geographic spillover (pricing changes in one area affect adjacent areas), and real-time experiments on dynamic systems (surge pricing, ETA estimation). They optimized their experiment evaluation engine to be 100x faster by transitioning from remote RPC-based evaluation to local client-side computation, reducing latency from milliseconds to microseconds.
Uber uses A/B testing to validate ML model changes across pricing algorithms, ETA prediction models, route optimization, fraud detection, and recommendation systems. The 100x evaluation speedup enabled experimentation in latency-sensitive code paths where remote evaluation was previously infeasible, expanding experimentation coverage to more engineering teams.
LinkedIn's XLNT platform is their end-to-end A/B testing solution that handles both standard experiments and sophisticated use cases unique to social networks (network effects, content virality, notification optimization). The Lix Engine, the heart of the platform, is embedded in approximately 500 production services. LinkedIn made their experimentation engine 20x faster through incremental computation and pre-aggregation, enabling rapid metric evaluation at their scale of 900M+ members.
LinkedIn runs A/B tests on feed ranking algorithms, job recommendation models, people-you-may-know suggestions, and notification timing. Their experimentation platform supports the company's shift to AI-driven products while maintaining rigorous statistical standards, including CUPED variance reduction and multiple comparison correction.
Flipkart, India's largest e-commerce platform, uses A/B testing extensively for search ranking, recommendation algorithms, pricing strategies, and checkout flow optimization. Their experimentation platform handles the unique challenges of the Indian market: extreme traffic spikes during Big Billion Days sales (10x normal traffic), heterogeneous user behavior across Tier 1 and Tier 3 cities, and multilingual user interfaces. Experiments must be robust across diverse network conditions (2G to 5G), device capabilities (budget Android phones to iPhones), and payment methods (UPI, COD, credit cards).
Flipkart uses A/B testing to validate ML-driven improvements across the purchase funnel. Search relevance improvements, personalized product recommendations, and dynamic pricing models are all validated through controlled experiments before full rollout. During high-stakes events like Big Billion Days, experimentation ensures that infrastructure changes handle scale without degrading conversion rates.
Adyen, the Dutch payment platform processing $767B+ annually, used contextual multi-armed bandits to optimize payment authorization rates in real-time. Rather than traditional A/B testing with fixed allocation periods, they deployed Thompson Sampling bandits that dynamically route transactions through different payment configurations (acquirer, card network, retry strategy) based on contextual features like merchant category, card type, and transaction amount (2020).
The bandit-based optimization approach improved payment authorization rates by 1-2 percentage points — translating to billions in additional successful transactions annually. The system adapts in real-time without requiring manual intervention, outperforming static rule-based routing.
Tooling & Ecosystem
Open-source experimentation platform with Bayesian statistics as the default analysis engine. Supports feature flags, A/B testing, and experimentation with a warehouse-native architecture (connects directly to your data warehouse for metric computation). Self-hostable with Docker or available as a managed cloud service. Pricing starts free for up to 3 users, with Pro at $20/user/month. Strong choice for teams that want full control over their experimentation data and prefer Bayesian analysis.
Comprehensive experimentation and feature management platform supporting both Bayesian and frequentist analysis, CUPED variance reduction, sequential testing, and session replay. Provides unlimited users and feature flags on the free tier -- pricing is based on analytics event volume. Founded by ex-Facebook experimentation team members. Particularly strong on automated statistical guardrails and real-time experiment monitoring. Used by companies like Notion, Figma, and Brex.
Enterprise experimentation platform with always-valid sequential testing (based on the mSPRT framework) that allows safe peeking at results without inflating false positive rates. Pioneered the concept of 'Stats Engine' for non-statistician users. Provides personalization via machine learning, multi-armed bandits, and server-side experimentation. Premium pricing model suited for large enterprises. Used by eBay, IBM, and Pizza Hut.
Feature management platform with experimentation capabilities. Primarily a feature flagging tool that added A/B testing as an extension. Supports metric tracking, experiment analysis, and progressive rollouts. Strong engineering-focused UX with excellent SDK coverage (25+ languages). Better suited for teams that primarily need feature flags and want experimentation as an add-on, rather than experimentation-first platforms.
A collection of free, well-designed online calculators for A/B testing: sample size calculator, chi-squared test, sequential testing calculator, and multi-armed bandit simulator. Created by Evan Miller, a statistician known for his influential blog posts on experimentation. Essential quick-reference tools for planning experiments and performing back-of-envelope calculations.
Python's standard library for statistical tests used in A/B test analysis. Includes ttest_ind for two-sample t-tests, chi2_contingency for proportion tests, mannwhitneyu for non-parametric tests, and norm for z-tests and confidence interval computation. Not an experimentation platform, but the statistical engine under the hood of most custom A/B test analysis scripts.
Research & References
Kohavi, Tang & Xu (2020)Cambridge University Press
The definitive textbook on A/B testing in technology companies. Authored by Ronny Kohavi (ex-Microsoft, Airbnb, Amazon) and colleagues, it covers experiment design, metric selection, guardrail metrics, statistical analysis, organizational culture, and real-world pitfalls. Essential reading for anyone designing experimentation systems.
Johari, Koomen, Pekelis & Walsh (2022)Operations Research
Introduces always-valid p-values and confidence intervals that maintain type I error control under continuous monitoring. Solves the 'peeking problem' in A/B testing where checking results before the sample size is reached inflates false positives. The mixture sequential probability ratio test (mSPRT) framework proposed here is the foundation for Optimizely's Stats Engine.
Deng, Xu, Kohavi & Walker (2013)WSDM 2013
Introduces CUPED (Controlled-experiment Using Pre-Experiment Data), a variance reduction technique that uses pre-experiment covariates to reduce the variance of treatment effect estimates. Achieves 20-50% variance reduction in practice, equivalent to increasing sample size by 25-100% for free. Implemented in virtually every major experimentation platform.
Johari, Koomen, Pekelis & Walsh (2017)KDD 2017
Quantifies the false positive inflation caused by continuous monitoring of A/B tests ('peeking'). Shows that checking daily can inflate the type I error rate from 5% to over 20%. Proposes practical solutions including always-valid inference and group sequential designs. A wake-up call for the industry on proper experiment analysis.
Xiang & West (2022)KDD 2022
Provides a rigorous comparison between multi-armed bandits and traditional A/B testing from the perspectives of confidence intervals and hypothesis test power. Shows that adaptive traffic allocation in MAB reduces statistical power for effect estimation, highlighting the inference-optimization tradeoff. Essential reading for choosing between MAB and A/B testing.
Deng & Shi (2023)arXiv preprint
Extends CUPED from a simple covariate adjustment to a general augmentation and decomposition framework. Shows how to apply CUPED to ratio metrics, percentile metrics, and in-experiment data (not just pre-experiment data), achieving significantly larger variance reduction. Updates the foundational CUPED work for modern experimentation needs.
Interview & Evaluation Perspective
Common Interview Questions
- ●
Design an A/B testing system for a recommendation model at an e-commerce platform. What are the key components?
- ●
You have a new search ranking model with 5% higher NDCG offline. How do you set up an A/B test to validate it online?
- ●
The A/B test shows a statistically significant improvement in CTR but a drop in revenue per user. What do you do?
- ●
How do you calculate the required sample size for an A/B test? Walk me through the formula.
- ●
What is the peeking problem in A/B testing, and how do you solve it?
- ●
Compare Bayesian and frequentist approaches to A/B testing. When would you use each?
- ●
How would you A/B test a pricing algorithm on a two-sided marketplace where treatment affects both buyers and sellers?
- ●
Your A/B test ran for 2 weeks and shows p=0.08. The product manager wants to extend it. Is that valid?
Key Points to Mention
- ●
A/B testing establishes causation through randomization -- this is the gold standard for evaluating ML model impact in production. Offline metrics (AUC, NDCG) are necessary but not sufficient.
- ●
The three critical numbers for experiment design are MDE (what's the smallest effect worth detecting), power (probability of detecting a real effect, typically 0.80), and alpha (false positive rate, typically 0.05). These determine the required sample size.
- ●
CUPED variance reduction uses pre-experiment covariates to reduce metric variance by 20-50%, effectively providing 25-100% more data for free. This is standard practice at every major experimentation platform.
- ●
The peeking problem is the most common mistake: checking p-values before the sample size is reached inflates false positive rates from 5% to 26%. Solutions include sequential testing (always-valid p-values), Bayesian analysis, or simply locking the dashboard.
- ●
Guardrail metrics (latency, error rate, crash rate, revenue) must not degrade regardless of primary metric outcome. These are non-negotiable safety constraints that prevent shipping changes that win on one metric but break others.
- ●
For marketplace experiments with network effects, standard user-level randomization is invalid because SUTVA is violated. Use cluster-randomized or switchback designs.
- ●
Multi-armed bandits (MAB) minimize regret during the experiment but provide weaker statistical inference. Use A/B tests for understanding ("what is the effect?") and MAB for optimization ("which variant is best?").
Pitfalls to Avoid
- ●
Saying you would 'just deploy to 50% and look at metrics' without discussing randomization, sample size, or statistical testing. A/B testing requires rigorous experimental design, not just a traffic split.
- ●
Claiming that 'p < 0.05 means the treatment works with 95% confidence.' The p-value is the probability of seeing this data under the null, not the probability that the treatment works. This is the most common statistical misinterpretation.
- ●
Ignoring the distinction between statistical significance and practical significance. Always ask: 'Is the effect large enough to justify the engineering cost of deployment?'
- ●
Forgetting to mention guardrail metrics. In an interview, demonstrating awareness of safety constraints (latency, error rate, revenue protection) shows production experience.
- ●
Not addressing how you would handle peeking. If the interviewer asks about monitoring results, and you describe a fixed-horizon frequentist test, you must explain why peeking is dangerous and propose sequential or Bayesian alternatives.
Senior-Level Expectation
A senior/staff candidate should design a complete experimentation system, not just describe the statistical test. This includes: (1) experiment design with pre-registered hypothesis, primary metric (OEC), guardrail metrics, and power analysis; (2) infrastructure covering deterministic hashing for randomization, traffic layering for concurrent experiments, and metric computation pipelines; (3) statistical methodology discussing CUPED variance reduction, sequential testing for safe peeking, and multiple comparison correction; (4) organizational process including experiment review boards, launch criteria, and result interpretation standards; (5) edge cases such as network effects (SUTVA violations in marketplaces), novelty effects, and long-term vs short-term effects.
The candidate should quantify the business impact: 'A 2% improvement in search conversion at Flipkart, with 300M monthly users and average order value of INR 1,500, translates to roughly INR 90 crore/month in additional GMV. The A/B test should run for 3 weeks with 50/50 split, requiring CUPED with pre-experiment search behavior as covariate to detect a 2% relative lift with 80% power.' This kind of back-of-envelope calculation demonstrates senior-level systems thinking.
Summary
The A/B Test Runner is the final validation gate in any production ML system -- the block that separates "the model improved offline" from "the model improved the business." It works by randomly assigning users to control (existing model) and treatment (new model) groups, measuring predefined metrics over a sufficient duration, and applying rigorous statistical analysis to determine whether the observed differences are real or noise.
The core of A/B testing rests on three pillars: randomization (eliminates confounders via deterministic hashing), statistical rigor (sample size calculation driven by MDE, power, and significance level), and guardrail metrics (safety constraints that prevent shipping changes that win on one metric but break others). Modern experimentation platforms add sophisticated enhancements: CUPED variance reduction provides 20-50% more effective data by leveraging pre-experiment behavior, sequential testing enables safe peeking without inflating false positives, and Bayesian analysis provides intuitive probability statements about treatment superiority.
For ML system design, the A/B Test Runner integrates with model serving (variant routing), metric pipelines (outcome measurement), alerting systems (guardrail monitoring), and deployment infrastructure (progressive rollout). The key design decisions are: randomization unit (user vs session vs cluster), analysis methodology (frequentist vs Bayesian vs sequential), traffic allocation (50/50 vs conservative ramp-up), and handling edge cases (network effects, novelty effects, delayed conversions). At scale, companies like Netflix, Booking.com, Uber, and LinkedIn run 1,000+ concurrent experiments, requiring traffic layering for experiment independence, incremental metric computation for performance, and democratized tooling for organizational adoption.
Bottom Line: You cannot call an ML system production-ready until it has been validated through a properly designed A/B test. Offline evaluation is hypothesis generation; A/B testing is hypothesis validation. Master both, and you will ship ML models that actually move the needle.