Serendipity in Machine Learning
Here is a question that most ML engineers building recommendation systems forget to ask: what if your recommendations are accurate but boring?
You can build a system that predicts user preferences with 95% precision -- and still produce a terrible user experience. If every recommendation is something the user already knows about, something they would have found on their own, or something that merely echoes their past behaviour, you have built a very expensive echo chamber. Users don't just want relevant items. They want to be pleasantly surprised.
This is exactly what the serendipity metric measures. It captures the degree to which a recommender system surfaces items that are both unexpected and relevant -- items the user would not have discovered on their own but genuinely enjoys. Serendipity is the metric that separates a recommendation system that merely mirrors user history from one that expands horizons and creates genuine delight.
The concept draws from the English word "serendipity" -- the art of making fortunate discoveries by chance. In recommendation systems, we formalise this intuition: serendipity = unexpectedness + relevance. An item is serendipitous if it deviates from what a simple baseline (the "primitive prediction model") would suggest, yet the user still finds it useful or enjoyable. Think of it as the anti-filter-bubble metric.
From Spotify's Discover Weekly playlists to Netflix's genre-crossing suggestions, from Flipkart's "You might also like" carousels to JioSaavn's mood-based music discovery -- serendipity is what transforms adequate recommendations into memorable experiences. If you are building any system that recommends content, products, or information to users, understanding and measuring serendipity is essential for long-term user engagement and retention.
Concept Snapshot
- What It Is
- A beyond-accuracy evaluation metric that measures how well a recommender system suggests items that are both unexpected (deviating from obvious, predictable choices) and relevant (genuinely useful or enjoyable to the user).
- Category
- Evaluation
- Complexity
- Intermediate
- Inputs / Outputs
- Inputs: a list of recommendations, user interaction history, and outputs from a primitive prediction model (baseline). Outputs: a serendipity score between 0 and 1, where higher values indicate more pleasantly surprising recommendations.
- System Placement
- Used during offline evaluation and online A/B testing of recommendation algorithms, typically alongside accuracy metrics (precision, recall, NDCG) and other beyond-accuracy metrics (novelty, diversity, coverage).
- Also Known As
- Serendipity Score, Unexpected Relevance, Surprise Metric, Pleasant Surprise Index
- Typical Users
- ML engineers, Recommendation system developers, Product managers, UX researchers, Data scientists
- Prerequisites
- Basic recommendation system concepts, Precision and recall fundamentals, Collaborative filtering basics, Understanding of user-item interaction matrices, Familiarity with content-based filtering
- Key Terms
- primitive prediction modelunexpectednessrelevancefilter bubblebeyond-accuracynoveltydiversityexploration-exploitation
Why This Concept Exists
The Accuracy Trap
For decades, recommendation system research was dominated by a single goal: minimise prediction error. The Netflix Prize (2006-2009) epitomised this -- teams competed to reduce RMSE on movie rating predictions, and the $1 million prize went to the team that improved accuracy by a modest 10.06%. The entire field optimised for one thing: predict what users will rate highly.
But here is the problem. A system that always recommends the most popular items in a user's preferred genre achieves excellent accuracy. If you love Bollywood action films, recommending the latest Rohit Shetty movie is a safe, accurate prediction. But it is also completely obvious. The user would have found that movie anyway. The recommendation adds zero value.
This is the accuracy trap: optimising solely for accuracy drives systems toward safe, predictable recommendations. The result is what Eli Pariser famously called the filter bubble -- users are shown an increasingly narrow slice of the item catalogue that reinforces their existing preferences. Over time, this degrades user satisfaction, reduces catalogue utilisation, and hurts business metrics like long-term retention.
The Need for "Beyond Accuracy" Metrics
Researchers began recognising this problem in the mid-2000s. McNee, Riedl, and Konstan published a landmark position paper in 2006 titled "Being Accurate is Not Enough: How Accuracy Metrics have hurt Recommender Systems," arguing that the field needed metrics beyond prediction accuracy. They observed that users value recommendations that help them discover new things, not just confirm what they already know.
This gave rise to a family of beyond-accuracy metrics: novelty (are the recommended items new to the user?), diversity (are the recommended items different from each other?), coverage (what fraction of the catalogue gets recommended?), and serendipity (are the recommendations both unexpected and relevant?).
Serendipity: The Hardest Beyond-Accuracy Metric
Among these metrics, serendipity is the most challenging to define and measure. Novelty only requires checking whether the user has seen the item before. Diversity only requires computing pairwise distances between recommended items. But serendipity requires two simultaneous conditions: the item must be unexpected (the user would not have predicted it) AND relevant (the user actually likes it).
The earliest formalisation came from Murakami, Hirata, and Kudo in 2008, who introduced the concept of a primitive prediction model -- a simple baseline recommender that captures obvious, predictable recommendations. An item is unexpected if the primitive model would not have recommended it. Serendipity is then the fraction of recommended items that are both unexpected and relevant.
This framework was refined by Ge, Delgado-Battenfeld, and Jannach (2010) and Zhang et al. (2012, Auralist system for music), and comprehensively surveyed by Kotkov, Wang, and Veijalainen (2016). Today, serendipity is recognised as a first-class evaluation dimension for any production recommendation system.
Key Insight: Serendipity exists because accuracy alone cannot capture user satisfaction. Users want to be surprised -- but only pleasantly. Serendipity measures exactly this: the intersection of surprise and delight.
Core Intuition & Mental Model
The Coffee Shop Analogy
Imagine you walk into your regular coffee shop every morning and order a cappuccino. A "highly accurate" barista would simply hand you a cappuccino without asking. Accurate? Yes. Delightful? Not really -- you would have ordered it yourself.
Now imagine a barista who says: "I know you love cappuccinos, but we just got this single-origin Ethiopian pour-over that has similar chocolate notes but with a bright citrus finish. Want to try it?" That suggestion is unexpected (you would never have ordered a pour-over on your own) but relevant (it connects to flavour profiles you already enjoy). If you try it and love it, that is a serendipitous recommendation.
Contrast that with a barista who says: "Try this matcha kombucha latte with activated charcoal." That is unexpected, sure, but if you hate matcha, it is just random noise -- not serendipity.
Serendipity = Unexpectedness x Relevance. Both components are essential. Remove unexpectedness and you get obvious recommendations. Remove relevance and you get random noise.
The Primitive Prediction Model
The key question is: unexpected relative to what? You need a baseline to define "expected." This is the primitive prediction model -- a deliberately simple recommender that captures the most obvious, predictable recommendations.
Common primitive models include:
- Most-popular items: Recommend the globally most popular items. If everyone has seen Inception, recommending it to any user is expected.
- User-based nearest neighbour: Recommend what similar users liked. If all users who liked A also liked B, recommending B to an A-lover is expected.
- Content-based baseline: Recommend items with the same genre, artist, or category as the user's history. If you listen to Arijit Singh, recommending another Arijit Singh song is expected.
Anything your sophisticated model recommends that the primitive model would NOT have recommended is unexpected. Among those unexpected items, the ones the user actually interacts with (clicks, purchases, listens to completion) are serendipitous.
Why Multiply, Not Add?
Serendipity is typically modelled as a product (or minimum) of unexpectedness and relevance, not a sum. This is intentional: you need BOTH components simultaneously. A perfectly unexpected but irrelevant recommendation scores zero. A perfectly relevant but expected recommendation also scores zero (or near-zero). Only items that satisfy both conditions contribute to serendipity. This multiplicative structure makes serendipity a strict, demanding metric.
Mental Model: Think of serendipity as the "pleasant surprise" score. It asks: "Among all the recommendations the user would NOT have found on their own, how many did they actually enjoy?" A high serendipity score means your system is genuinely expanding user horizons -- not just echoing their history or serving random noise.
Technical Foundations
Mathematical Formulation
We build the serendipity metric step by step, starting from the foundational components.
Step 1: Define the Primitive Prediction Model
Let denote the set of items recommended by a primitive prediction model for user . The primitive model is a deliberately simple baseline that captures "obvious" recommendations. Common choices:
- Popularity baseline:
- History-based baseline:
- Nearest-neighbour baseline:
Step 2: Define Unexpectedness
Let denote the set of items recommended by the system being evaluated. An item is unexpected for user if it is NOT in the primitive model's recommendations:
Alternatively, a continuous (soft) unexpectedness score can be defined using the distance between the item's representation and the user's profile under the primitive model:
where is the item embedding and is the user profile from the primitive model.
Step 3: Define Relevance
An item is relevant to user if the user actually interacted with it positively (clicked, purchased, rated highly, listened to completion):
Step 4: Serendipity Per Item
The serendipity of a single recommended item is the product of unexpectedness and relevance:
This ensures that only items which are BOTH unexpected AND relevant contribute to the score.
Step 5: Serendipity of a Recommendation List (Murakami et al. 2008)
For user with recommendation list of length :
where is the set of items user finds relevant.
In words: serendipity is the fraction of recommended items that are both unexpected (not in the primitive model's output) and relevant (the user liked them).
Step 6: System-Level Serendipity
Average across all users :
Ge et al. (2010) Variant
Ge, Delgado-Battenfeld, and Jannach proposed a slightly different formulation that uses a usefulness function instead of binary relevance:
where and are the predicted ratings from the evaluated system and the primitive model, respectively. The ensures only items where the system outperforms the baseline contribute.
Zhang et al. (2012) -- Auralist Variant
The Auralist system for music recommendation uses a continuous unexpectedness score based on content distance:
where is user 's listening history and is the content similarity between items and . Items that are dissimilar to everything in the user's history are more unexpected.
Properties
- Serendipity = 0 when all recommendations are either expected OR irrelevant
- Serendipity = 1 when every recommendation is both unexpected and relevant (extremely rare)
- Serendipity is sensitive to the choice of primitive model -- changing the baseline changes the score
- Higher serendipity typically comes at the cost of lower accuracy (there is an inherent tension)
Implementation Note: The choice of primitive prediction model is the single most important design decision. A too-simple primitive model (e.g., random) makes everything look unexpected, inflating serendipity. A too-sophisticated primitive model makes nothing look unexpected, deflating serendipity. The primitive model should capture what a reasonable user would expect -- typically popularity-based or simple collaborative filtering.
Internal Architecture
Serendipity is a metric, not a deployable service, but there is a well-defined computational architecture for how it integrates into the evaluation pipeline of a recommendation system. The key architectural insight is that serendipity requires two recommendation models to compute: the system under evaluation and the primitive prediction model (baseline). Here is the data flow:
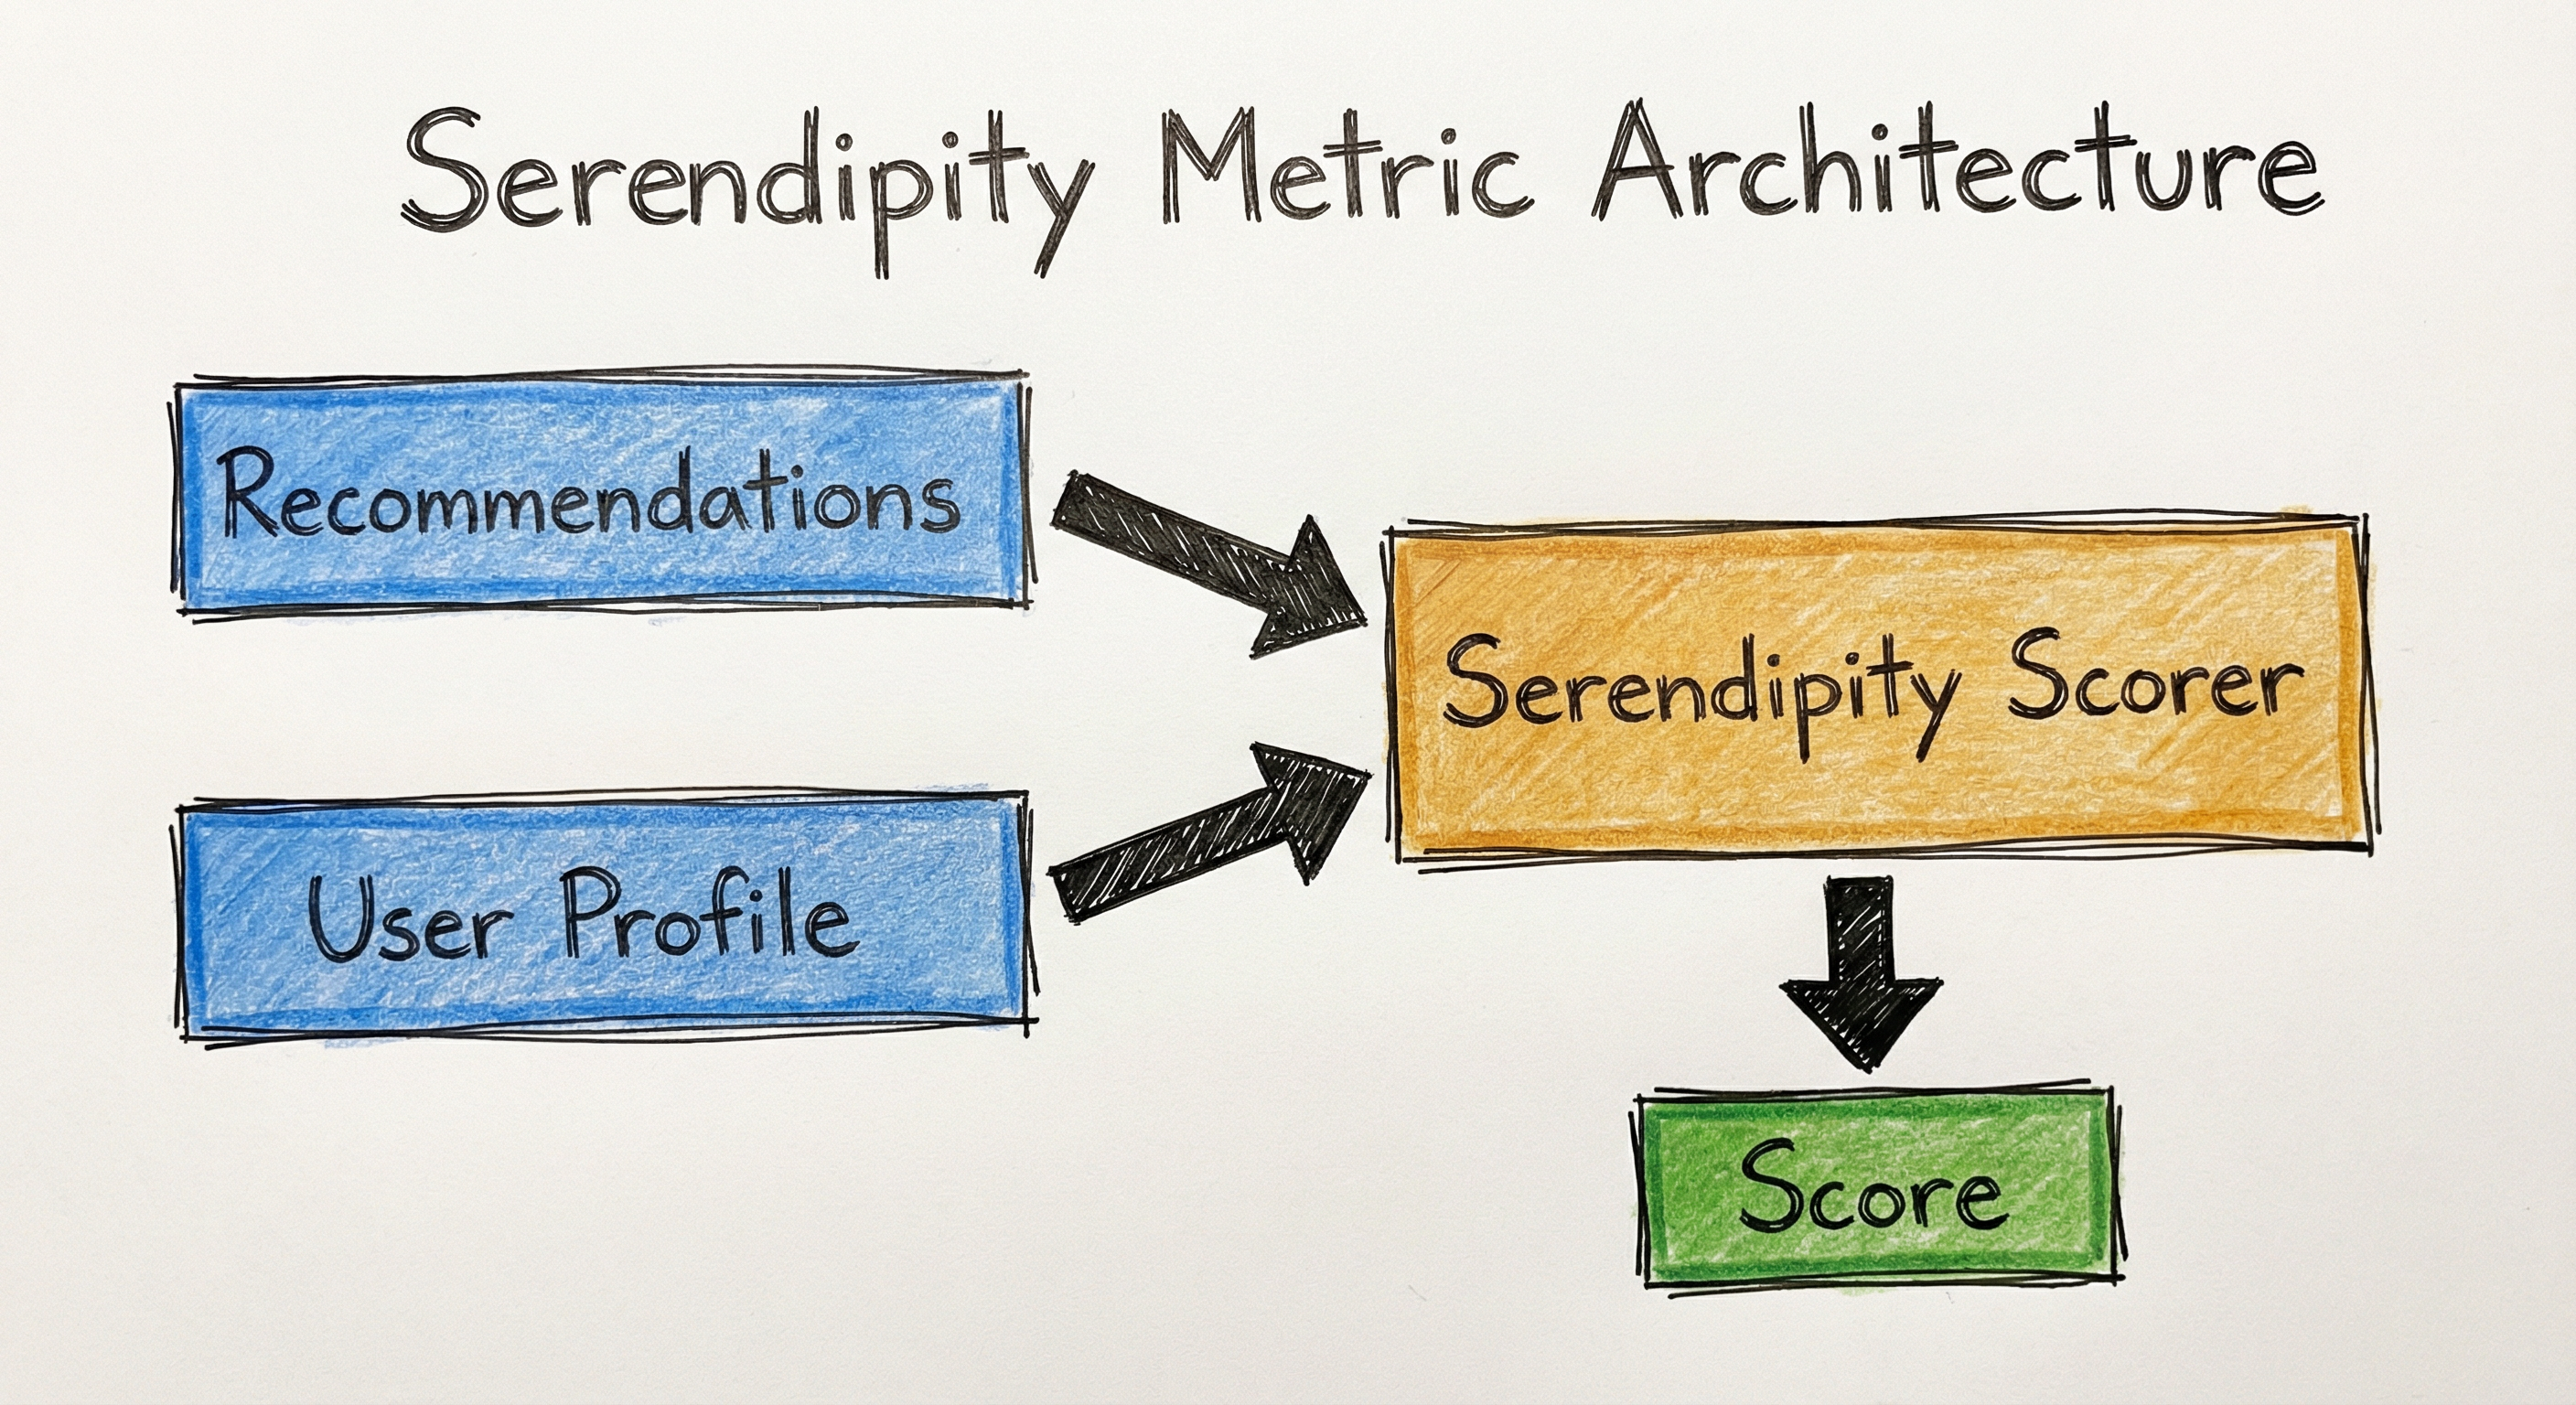
The architecture has two parallel paths: the evaluated recommendation system produces a recommendation list, while the primitive prediction model produces a set of "expected" items. The serendipity calculator takes both outputs plus ground-truth user feedback, filters for items that are unexpected (not in the primitive model's output), checks which of those unexpected items are relevant (user interacted positively), and computes the serendipity score. This score is then aggregated across all users for system-level evaluation.
Key Components
Evaluated Recommendation System
The sophisticated recommendation model being evaluated -- could be a deep learning model, hybrid collaborative-content system, or any algorithm. Produces a ranked list of items per user.
Primitive Prediction Model (Baseline)
A deliberately simple recommender that captures obvious, predictable recommendations. Common implementations: top-K globally popular items, user-specific genre/category mode, or basic nearest-neighbour collaborative filtering. This defines the boundary between 'expected' and 'unexpected'.
Unexpectedness Filter
Compares the evaluated system's recommendations against the primitive model's output. Items NOT in the primitive model's recommendations are flagged as unexpected. Can use binary (in/not-in) or continuous (distance-based) scoring.
Relevance Checker
Determines whether each unexpected item is actually relevant to the user. Uses ground-truth feedback: explicit ratings (4+ out of 5), implicit signals (clicks, purchases, listen-through rate, dwell time), or human annotations.
Serendipity Score Calculator
Multiplies unexpectedness by relevance for each item, then averages across the recommendation list. Produces per-user serendipity scores between 0 and 1.
Aggregation Layer
Averages serendipity scores across all test users to produce system-level serendipity. May also compute per-segment serendipity (e.g., by user activity level, item category, user demographics) for deeper analysis.
Data Flow
Input: A test set of users with their interaction histories, a recommendation list per user from the evaluated system, a set of expected items per user from the primitive model, and ground-truth feedback (which recommended items the user actually engaged with).
For each user :
- Evaluated system generates recommendation list
- Primitive model generates expected items
- Compute unexpected set:
- Identify relevant items from ground truth:
- Compute serendipitous items:
- Calculate score:
Output: System-level serendipity =
In online A/B testing, the primitive model runs alongside the experimental model, and ground-truth feedback comes from real user interactions (clicks, purchases, listen-through). In offline evaluation, ground-truth comes from a held-out test set of user interactions.
A directed flow with two parallel inputs: 'User Profile' feeds into both 'Evaluated RecSys' (producing 'Recommendation List') and 'Primitive Model' (producing 'Expected Items'). Both outputs, along with 'User Feedback / Ground Truth', feed into the 'Serendipity Calculator', which applies an 'Unexpectedness Filter' then a 'Relevance Filter' to produce a 'Serendipity Score', which feeds into 'Aggregate Metrics'.
How to Implement
Three Approaches to Measuring Serendipity
Unlike metrics such as NDCG or precision that have standard library implementations, serendipity is not available out-of-the-box in most ML libraries (scikit-learn, Surprise, RecBole). You will almost certainly need to implement it yourself. The good news: the implementation is straightforward once you choose your primitive prediction model.
Option A: Binary unexpectedness with popularity baseline -- the simplest approach. Define "expected" as the top-K most popular items globally. Any recommended item NOT in this set that the user likes is serendipitous. Easy to implement, easy to explain, but crude -- it treats all non-popular items equally.
Option B: Content-distance unexpectedness -- define unexpectedness as the content distance between recommended items and the user's history. An item whose genre, artist, or feature vector is far from anything in the user's past is more unexpected. More nuanced than binary, but requires item features or embeddings.
Option C: Model-based unexpectedness (Ge et al.) -- train a simple collaborative filtering model as the primitive prediction model. Items where the sophisticated model's predicted score significantly exceeds the primitive model's score are serendipitous. The most principled approach, but requires training two models.
For production systems, Option A is common for quick evaluation, Option B is popular in content recommendation (music, video, articles), and Option C is used in rigorous academic evaluation.
Cost Note: Computing serendipity itself is cheap (simple set operations and averaging). The real cost is in the primitive model. A popularity baseline costs nothing. A collaborative filtering baseline requires training a model (a few minutes on a GPU, or INR 50-200 on cloud compute for a medium dataset). The most expensive part is collecting ground-truth relevance labels -- expect INR 30-80 per label if using crowdsourcing for explicit feedback, or use implicit feedback (clicks, purchases) for free.
import numpy as np
from collections import Counter
from typing import Dict, List, Set, Tuple

def compute_serendipity_popularity(
    recommendations: Dict[int, List[int]],
    user_relevant: Dict[int, Set[int]],
    train_interactions: List[Tuple[int, int]],
    top_k_popular: int = 100,
    rec_list_size: int = 10,
) -> Dict[str, float]:
    """Compute serendipity using popularity as the primitive model.

    Args:
        recommendations: {user_id: [item_id, ...]} recommended items per user
        user_relevant: {user_id: {item_id, ...}} items user engaged with
        train_interactions: [(user_id, item_id), ...] training interactions
        top_k_popular: number of popular items to consider "expected"
        rec_list_size: number of recommendations per user (N)

    Returns:
        dict with per-user scores and system-level serendipity
    """
    # Step 1: Build popularity-based primitive model
    item_counts = Counter(item for _, item in train_interactions)
    popular_items = set(
        item for item, _ in item_counts.most_common(top_k_popular)
    )

    # Step 2: Compute per-user serendipity
    user_scores = {}
    for user_id, rec_list in recommendations.items():
        rec_set = set(rec_list[:rec_list_size])
        relevant = user_relevant.get(user_id, set())

        # Unexpected = not in popular items
        unexpected = rec_set - popular_items

        # Serendipitous = unexpected AND relevant
        serendipitous = unexpected & relevant

        score = len(serendipitous) / len(rec_set) if rec_set else 0.0
        user_scores[user_id] = score

    # Step 3: System-level serendipity
    system_score = np.mean(list(user_scores.values()))

    return {
        "per_user": user_scores,
        "system_serendipity": float(system_score),
        "num_users": len(user_scores),
        "primitive_model": f"top-{top_k_popular} popular items",
    }

# Example usage
recommendations = {
    1: [101, 205, 310, 412, 550, 603, 711, 820, 905, 999],
    2: [102, 205, 315, 420, 555, 610, 720, 830, 910, 998],
}

user_relevant = {
    1: {101, 310, 550, 711, 999},  # Items user 1 actually liked
    2: {315, 555, 720, 910},        # Items user 2 actually liked
}

train_interactions = [
    (1, 101), (1, 102), (2, 101), (2, 205),
    (3, 101), (3, 205), (3, 310), (4, 101),
    (4, 205), (5, 101), (5, 205), (5, 102),
]  # Items 101, 205, 102 are most popular

result = compute_serendipity_popularity(
    recommendations, user_relevant, train_interactions,
    top_k_popular=3, rec_list_size=10
)
print(f"System Serendipity: {result['system_serendipity']:.4f}")
# For user 1: unexpected = {310,412,550,603,711,820,905,999}
#              serendipitous = {310,550,711,999} -> 4/10 = 0.40
# For user 2: unexpected = {315,420,555,610,720,830,910,998}
#              serendipitous = {315,555,720,910} -> 4/10 = 0.40
# System: 0.40
This is the simplest serendipity implementation. The primitive model is just the set of globally popular items. Any recommended item NOT in the popular set that the user actually liked is serendipitous. The score is the fraction of such items in the recommendation list. This approach is fast and easy to understand, but it treats all non-popular items as equally unexpected -- a niche item from the user's favourite genre is treated the same as a completely out-of-profile item.
import numpy as np
from typing import Dict, List, Set
from sklearn.metrics.pairwise import cosine_similarity

def compute_serendipity_content(
    recommendations: Dict[int, List[int]],
    user_relevant: Dict[int, Set[int]],
    user_history: Dict[int, List[int]],
    item_embeddings: Dict[int, np.ndarray],
    rec_list_size: int = 10,
) -> Dict[str, float]:
    """Compute serendipity using content distance as unexpectedness.

    Items that are dissimilar to everything in the user's history
    are considered more unexpected (continuous score).

    Args:
        recommendations: {user_id: [item_id, ...]} recommended items
        user_relevant: {user_id: {item_id, ...}} relevant items
        user_history: {user_id: [item_id, ...]} past interactions
        item_embeddings: {item_id: np.ndarray} item feature vectors
        rec_list_size: number of recommendations per user

    Returns:
        dict with per-user scores and system-level serendipity
    """
    user_scores = {}

    for user_id, rec_list in recommendations.items():
        rec_list = rec_list[:rec_list_size]
        history = user_history.get(user_id, [])
        relevant = user_relevant.get(user_id, set())

        if not history or not rec_list:
            user_scores[user_id] = 0.0
            continue

        # Build user history embedding matrix
        history_embeds = np.array([
            item_embeddings[item] for item in history
            if item in item_embeddings
        ])

        if history_embeds.shape[0] == 0:
            user_scores[user_id] = 0.0
            continue

        total_serendipity = 0.0
        for item in rec_list:
            if item not in item_embeddings:
                continue

            item_embed = item_embeddings[item].reshape(1, -1)

            # Unexpectedness = 1 - max similarity to any history item
            similarities = cosine_similarity(item_embed, history_embeds)[0]
            max_sim = np.max(similarities)
            unexpectedness = 1.0 - max_sim

            # Relevance: binary
            relevance = 1.0 if item in relevant else 0.0

            # Serendipity = unexpectedness * relevance
            total_serendipity += unexpectedness * relevance

        user_scores[user_id] = total_serendipity / len(rec_list)

    system_score = np.mean(list(user_scores.values())) if user_scores else 0.0

    return {
        "per_user": user_scores,
        "system_serendipity": float(system_score),
        "num_users": len(user_scores),
        "primitive_model": "content-distance (cosine similarity)",
    }

# Example with mock embeddings
np.random.seed(42)
item_embeddings = {i: np.random.randn(64) for i in range(1000)}

result = compute_serendipity_content(
    recommendations={1: [100, 200, 300, 400, 500]},
    user_relevant={1: {200, 400, 500}},
    user_history={1: [10, 20, 30, 40, 50]},
    item_embeddings=item_embeddings,
    rec_list_size=5,
)
print(f"System Serendipity: {result['system_serendipity']:.4f}")
This implementation uses content-based unexpectedness. Instead of binary in/not-in, unexpectedness is a continuous score based on how dissimilar a recommended item is to everything in the user's history (using cosine similarity on item embeddings). An item from a completely different genre/topic scores high unexpectedness. Combined with binary relevance, this produces a more nuanced serendipity score. This approach is particularly useful for music, video, and article recommendation where item embeddings capture content features well.
import numpy as np
from typing import Dict, List, Set, Tuple
from sklearn.neighbors import NearestNeighbors
from scipy.sparse import csr_matrix

def build_primitive_model(
    train_interactions: List[Tuple[int, int, float]],
    n_users: int,
    n_items: int,
    k_neighbours: int = 20,
) -> Tuple[csr_matrix, NearestNeighbors]:
    """Build a user-based KNN primitive prediction model."""
    # Build user-item matrix
    rows = [u for u, _, _ in train_interactions]
    cols = [i for _, i, _ in train_interactions]
    vals = [r for _, _, r in train_interactions]
    user_item = csr_matrix((vals, (rows, cols)), shape=(n_users, n_items))

    # Fit KNN on user vectors
    knn = NearestNeighbors(n_neighbors=k_neighbours, metric='cosine')
    knn.fit(user_item)

    return user_item, knn

def primitive_predict(user_id, item_id, user_item, knn, k=20):
    """Predict rating using primitive KNN model."""
    distances, indices = knn.kneighbors(
        user_item[user_id].reshape(1, -1), n_neighbors=k
    )
    neighbour_ratings = user_item[indices[0], item_id].toarray().flatten()
    weights = 1 - distances[0]  # Convert distance to similarity

    # Weighted average of neighbour ratings
    mask = neighbour_ratings > 0
    if mask.sum() == 0:
        return 0.0
    return float(np.average(neighbour_ratings[mask], weights=weights[mask]))

def compute_serendipity_model_based(
    recommendations: Dict[int, List[int]],
    user_relevant: Dict[int, Set[int]],
    evaluated_predictions: Dict[int, Dict[int, float]],
    train_interactions: List[Tuple[int, int, float]],
    n_users: int,
    n_items: int,
    rec_list_size: int = 10,
) -> Dict[str, float]:
    """Compute serendipity using model-based unexpectedness (Ge et al.).

    Serendipity = avg over items of:
        max(pred_eval(u,i) - pred_prim(u,i), 0) * rel(u,i)

    Args:
        recommendations: {user_id: [item_id, ...]} recommended items
        user_relevant: {user_id: {item_id, ...}} relevant items
        evaluated_predictions: {user_id: {item_id: score}} model predictions
        train_interactions: [(user, item, rating), ...] for primitive model
        n_users: total number of users
        n_items: total number of items
        rec_list_size: number of recommendations
    """
    # Build primitive model
    user_item, knn = build_primitive_model(
        train_interactions, n_users, n_items
    )

    user_scores = {}
    for user_id, rec_list in recommendations.items():
        rec_list = rec_list[:rec_list_size]
        relevant = user_relevant.get(user_id, set())
        preds = evaluated_predictions.get(user_id, {})

        total_serendipity = 0.0
        for item in rec_list:
            # Evaluated model's prediction
            pred_eval = preds.get(item, 0.0)

            # Primitive model's prediction
            pred_prim = primitive_predict(
                user_id, item, user_item, knn
            )

            # Unexpectedness: how much the model outperforms baseline
            unexpectedness = max(pred_eval - pred_prim, 0.0)

            # Relevance
            relevance = 1.0 if item in relevant else 0.0

            total_serendipity += unexpectedness * relevance

        # Normalize by list size and max possible unexpectedness
        user_scores[user_id] = total_serendipity / len(rec_list)

    system_score = np.mean(list(user_scores.values())) if user_scores else 0.0

    return {
        "per_user": user_scores,
        "system_serendipity": float(system_score),
        "num_users": len(user_scores),
        "primitive_model": "user-based KNN collaborative filtering",
    }

print("Model-based serendipity ready for evaluation")
print("Requires: train set, eval model predictions, ground truth")
This implements the Ge et al. (2010) variant where unexpectedness is the gap between the evaluated model's predicted score and the primitive model's predicted score. The primitive model here is a user-based KNN collaborative filter. Items where the sophisticated model assigns much higher scores than the simple baseline are considered more unexpected. This is the most principled approach because it directly measures how much the evaluated model 'disagrees' with the obvious baseline on a per-item basis.
# Using the Elliot framework for comprehensive RecSys evaluation
# Install: pip install elliot
# Config file: serendipity_eval.yml

# --- serendipity_eval.yml ---
experiment:
  dataset: movielens_1m
  data_config:
    strategy: fixed
    train_path: ./data/train.tsv
    validation_path: ./data/val.tsv
    test_path: ./data/test.tsv
  models:
    MostPop:  # Primitive model (baseline)
      meta:
        verbose: True
    ItemKNN:  # Simple baseline
      meta:
        verbose: True
      neighbors: 50
      similarity: cosine
    MultiVAE:  # Sophisticated model to evaluate
      meta:
        verbose: True
      lr: 0.001
      epochs: 50
      intermediate_dim: 200
      latent_dim: 64
  evaluation:
    cutoffs: [5, 10, 20]
    simple_metrics:
      - Precision
      - Recall
      - nDCG
      - Novelty       # Beyond accuracy: novelty
      - EPC           # Expected Popularity Complement
      - EFD           # Expected Free Discovery
      - GiniIndex     # Distribution fairness
    complex_metrics:
      - SRecall       # Serendipity-aware recall

# --- Python script to run ---
from elliot.run import run_experiment

run_experiment("serendipity_eval.yml")
# Results saved to ./results/ with all metrics per model
# Compare MostPop (primitive) vs MultiVAE (evaluated)
# Items recommended by MultiVAE but NOT by MostPop = unexpected
# Among those, items user actually liked = serendipitous
The Elliot framework provides a comprehensive evaluation pipeline for recommender systems with built-in support for beyond-accuracy metrics including novelty (EPC, EFD) and distribution metrics (Gini). While Elliot does not have a direct 'serendipity' metric, you can compute it by comparing the outputs of the primitive model (MostPop or ItemKNN) against the sophisticated model (MultiVAE). The framework handles data splitting, model training, and multi-metric evaluation in a single configuration file.
# Serendipity evaluation configuration
primitive_model:
  type: popularity  # or 'knn', 'content_based'
  top_k: 100        # Number of items in primitive model output

evaluation:
  metrics:
    - serendipity
    - precision
    - recall
    - ndcg
    - novelty
    - diversity
  cutoffs: [5, 10, 20]
  relevance_threshold: 4.0  # Min rating to count as relevant

reporting:
  per_user: true
  per_category: true
  confidence_interval: 0.95
  statistical_test: paired_t_test
Common Implementation Mistakes
- ●
Choosing a trivial primitive model: Using a random recommender as the primitive model makes everything look unexpected, artificially inflating serendipity scores. The primitive model should represent what a reasonable, simple system would recommend -- popularity-based or basic collaborative filtering. If your serendipity score is above 0.8, your primitive model is probably too weak.
- ●
Ignoring the relevance component: Computing only unexpectedness without checking relevance. A system that recommends random items from the long tail will appear "unexpected" but users will hate it. Always multiply unexpectedness by relevance -- items must be BOTH unexpected AND liked.
- ●
Using the same model as both evaluator and primitive: If your evaluated model is a neural collaborative filter and your primitive model is also a neural collaborative filter (just with different hyperparameters), the unexpectedness signal will be weak and uninformative. The primitive model should be fundamentally simpler in approach.
- ●
Not controlling for K (list size): Serendipity at K=5 is very different from K=50. Longer lists naturally include more niche items, inflating apparent serendipity. Always report serendipity at a specific K that matches your UI (e.g., K=10 for a single page of recommendations).
- ●
Confusing serendipity with novelty: Novelty measures whether the user has seen the item before (new vs. old). Serendipity measures whether the item is unexpected AND relevant. A novel item can be completely predictable (a new release in the user's favourite genre). A serendipitous item must be surprising. They are related but distinct metrics.
- ●
Evaluating serendipity offline only: Offline serendipity uses held-out test data as ground truth, but this data is biased toward items the user discovered through the existing system. True serendipity -- helping users discover items they would never have found -- is hard to measure offline. Always validate with online A/B tests and user surveys.
When Should You Use This?
Use When
You are building a recommendation system where user discovery and exploration are business-critical (music streaming, content platforms, e-commerce with diverse catalogues)
Your system suffers from filter bubble effects -- users are seeing increasingly narrow, repetitive recommendations and engagement is declining over time
You want to measure whether your recommendation algorithm adds value beyond what a simple popularity-based or collaborative filtering baseline would provide
User satisfaction surveys indicate users want more surprising or diverse recommendations, not just accurate ones
You are comparing multiple recommendation algorithms and need to distinguish between one that merely predicts known preferences and one that genuinely expands user horizons
Your business model benefits from long-tail item discovery (e.g., independent music, niche products, long-tail content) where serendipity drives catalogue utilisation
Avoid When
Your application requires high-precision, predictable recommendations where surprises are unwanted (e.g., medical treatment recommendations, safety-critical systems, financial product matching)
You do not have ground-truth relevance feedback -- serendipity requires knowing which recommended items users actually liked, not just which were clicked
Your item catalogue is very small (under 1000 items) and most users have interacted with most items -- there is little room for unexpectedness in a small, well-explored catalogue
You cannot define a meaningful primitive prediction model for your domain -- if there is no obvious 'simple baseline' for what users would expect, serendipity scores are hard to interpret
You are optimising for immediate conversion (e.g., retargeting ads) where showing exactly what users are looking for is the goal, not expanding their horizons
Your evaluation dataset lacks sufficient user-item interactions to reliably distinguish unexpected items from items the user simply has not encountered yet
Key Tradeoffs
The Fundamental Tension: Accuracy vs. Serendipity
Serendipity and accuracy are inherently in tension. Maximising accuracy means recommending the most predictable, "safe" items. Maximising serendipity means deviating from predictions toward less predictable territory. In practice, improving serendipity by 10% typically costs 2-5% in accuracy (measured by precision or NDCG).
This is not always a bad trade. Research by Li et al. (2019, WWW Conference) on a large-scale mobile e-commerce platform showed that users who received more serendipitous recommendations reported higher overall satisfaction despite slightly lower per-item relevance. The key insight: users evaluate the overall experience, not individual recommendations. A list with 8 predictable good items and 2 surprising discoveries feels better than 10 predictable good items.
Choosing the Primitive Model: Sensitivity Analysis
| Primitive Model | Pros | Cons |
|---|---|---|
| Top-K Popular | Simple, fast, stable | Too crude; any niche item looks unexpected |
| Genre/Category Mode | Captures user preferences | Misses cross-genre preferences |
| User-KNN | Captures collaborative signals | Expensive to compute; parameter-sensitive |
| Content-based | Captures feature-level expectations | Requires item features/embeddings |
The choice of primitive model changes serendipity scores dramatically. Always report which primitive model you used and consider running sensitivity analysis across multiple baselines.
Online vs. Offline Serendipity
Offline serendipity (computed on held-out test data) underestimates true serendipity because the test set only contains items users discovered through the existing system. Items that are truly serendipitous -- things the user would love but has never encountered -- are missing from offline data. Online evaluation (A/B tests with real users) captures this better but is expensive and slow. The recommended approach is to use offline serendipity for model development and online metrics for final validation.
Rule of Thumb: A healthy recommendation system targets serendipity between 0.05 and 0.20 (with a popularity baseline). Below 0.05 suggests the system is in a filter bubble. Above 0.20 suggests the system may be too random. Calibrate based on your domain and user expectations.
Alternatives & Comparisons
Novelty measures whether recommended items are new to the user (based on item popularity or whether the user has seen them before). It does NOT require items to be relevant -- a novel item the user hates still counts as novel. Serendipity is strictly harder: items must be both novel/unexpected AND relevant. Use novelty when you want to measure catalogue exploration regardless of quality; use serendipity when you care about quality surprises.
Diversity measures how different recommended items are from each other (intra-list diversity). A diverse list covers many genres/topics. Serendipity measures how different items are from what the user EXPECTS, not from each other. A diverse list can be entirely predictable (one popular item per genre). A serendipitous list may not be diverse (all items from one unexpected genre). Use diversity for breadth within a list; use serendipity for deviation from expectations.
Coverage measures what fraction of the item catalogue gets recommended across all users. High coverage means the system does not concentrate on a small set of popular items. Coverage is a system-level metric; serendipity is a per-user metric. A system can have high coverage (recommending everything to someone) but low serendipity (always recommending the obvious choice per user). Use coverage to check catalogue utilisation; use serendipity to check per-user surprise.
NDCG measures ranking quality: are the most relevant items at the top of the list? It is purely an accuracy metric with no notion of unexpectedness. A system that always recommends the same obvious items in perfect order scores maximum NDCG. Serendipity complements NDCG by measuring the dimension that NDCG ignores: surprise. Use NDCG for ranking accuracy; use serendipity alongside NDCG to ensure the system is not just accurate but also exploratory.
Pros, Cons & Tradeoffs
Advantages
Captures user delight directly: Serendipity measures the intersection of surprise and relevance, which correlates more strongly with long-term user satisfaction than accuracy alone. Research shows serendipitous recommendations increase user retention and platform loyalty.
Detects filter bubbles: A low serendipity score is an early warning that your system is trapped in an echo chamber, recommending the same types of items repeatedly. This is actionable -- you know you need more exploration.
Complements accuracy metrics: Serendipity fills the blind spot that precision, recall, and NDCG cannot address. Two systems with identical NDCG can have vastly different serendipity, and the higher-serendipity system often wins in A/B tests.
Drives long-tail discovery: High serendipity means more catalogue items get discovered, benefiting niche creators, independent artists, and small sellers. This is especially valuable in multi-sided marketplaces like Flipkart, Etsy, or Spotify where supplier diversity matters.
Intuitive interpretation: Unlike many metrics, serendipity has a clear human meaning -- "what fraction of recommendations are pleasant surprises?" This makes it easy to communicate to product managers, designers, and executives.
Encourages algorithmic innovation: Optimising for serendipity pushes teams beyond simple collaborative filtering toward more creative approaches (exploration strategies, graph-based recommendations, cross-domain transfer, LLM-based reasoning).
Disadvantages
Sensitive to primitive model choice: Different primitive models produce vastly different serendipity scores for the same recommendation system. A popularity baseline gives higher serendipity than a KNN baseline. Scores are not comparable across different primitive model choices.
Requires ground-truth relevance: You cannot compute serendipity without knowing which items users actually liked. This requires either explicit ratings (expensive to collect) or implicit feedback (noisy and biased). Budget INR 30-80 per relevance label if using crowdsourcing.
Hard to optimise directly: Unlike NDCG (which has differentiable approximations like LambdaMART), serendipity has no widely-adopted differentiable surrogate loss. You typically optimise for accuracy and diversity separately, then check serendipity post-hoc.
Tension with accuracy: Improving serendipity usually means sacrificing some accuracy. Recommending unexpected items inevitably includes more items the user won't like. Finding the right balance requires careful A/B testing and is domain-specific.
Offline evaluation is limited: Offline serendipity computed on held-out test sets systematically underestimates true serendipity because the test set only contains items users already discovered. You cannot measure serendipity for items the user has never encountered.
No standard implementation: Unlike precision or NDCG, serendipity is not available in scikit-learn, TensorFlow Ranking, or most standard ML libraries. You need custom code, which introduces implementation inconsistencies across teams and papers.
Cultural and personal subjectivity: What feels "surprising" varies dramatically across users and cultures. A jazz recommendation to a Bollywood listener in Mumbai is more surprising than to a world music enthusiast in Berlin. The metric does not capture this subjectivity.
Failure Modes & Debugging
Trivial Primitive Model Inflation
Cause
Using a random recommender or an extremely simple baseline (e.g., always recommend the single most popular item) as the primitive prediction model. This makes almost every recommendation look "unexpected," inflating serendipity scores to meaningless levels.
Symptoms
Serendipity scores consistently above 0.6-0.8 for all models, including simple baselines. Serendipity scores do not differentiate between sophisticated and naive algorithms. The metric loses discriminative power.
Mitigation
Use a primitive model that captures genuine user expectations: top-100 popular items, user-based KNN with K=20-50, or a content-based recommender using the user's dominant genre/category. Validate by checking that the primitive model itself achieves reasonable accuracy (precision@10 > 0.1). If the primitive model is so bad that it never recommends anything useful, it is too trivial.
Confounding Novelty with Serendipity
Cause
Treating any recommendation of a new or obscure item as serendipitous without verifying relevance. A system that recommends random long-tail items appears "unexpected" but produces terrible user experience.
Symptoms
High serendipity scores but declining click-through rates, user satisfaction scores, and retention. Users report feeling confused or frustrated by irrelevant recommendations despite the metric showing improvement.
Mitigation
Always multiply unexpectedness by relevance. Monitor serendipity alongside accuracy metrics (precision, NDCG). If serendipity increases but accuracy decreases sharply, the system is producing random noise, not genuine serendipity. A healthy system shows moderate serendipity (0.05-0.20) with stable or slightly decreased accuracy.
Offline-Online Serendipity Gap
Cause
Optimising for offline serendipity (computed on held-out test data) but finding no improvement in online A/B tests. The offline test set is biased toward items users already discovered through the existing system, so truly serendipitous items are systematically missing from the evaluation.
Symptoms
Offline serendipity improves by 20-30% but online metrics (CTR, dwell time, user satisfaction surveys) show no change or even decline. The "improvement" is an artefact of the biased offline evaluation, not genuine serendipity.
Mitigation
Supplement offline evaluation with online experiments. Use counterfactual evaluation methods (inverse propensity scoring) to correct for exposure bias in offline data. Conduct user studies where a sample of users explicitly rate whether recommendations were "pleasantly surprising." Consider using exploration policies (epsilon-greedy, Thompson sampling) during data collection to reduce bias.
Cold-Start Serendipity Collapse
Cause
New users with little or no interaction history. The primitive model cannot generate meaningful "expected" items, so the unexpectedness calculation is unreliable. Similarly, without enough history, relevance prediction is poor.
Symptoms
Extremely high serendipity scores for new users (everything is unexpected) that do not reflect genuine pleasant surprise. Alternatively, serendipity is undefined (division by zero) for users with empty histories.
Mitigation
Exclude cold-start users (fewer than N interactions, e.g., N=10) from serendipity calculation, or report serendipity separately for cold and warm users. For cold-start users, rely on other metrics (click-through rate, explicit satisfaction surveys). Build the primitive model using demographic or contextual features for new users rather than interaction history.
Popularity Bias in Relevance Labels
Cause
Using implicit feedback (clicks, purchases) as relevance labels introduces popularity bias. Users interact with popular items more because they are exposed more, not necessarily because they prefer them. This makes popular items appear "relevant," reducing serendipity for systems that recommend popular items.
Symptoms
Systems that recommend more popular items appear to have HIGHER relevance (because popular items get more clicks), which paradoxically gives them higher serendipity in the non-popular items they do recommend. The metric rewards popularity-biased systems.
Mitigation
Apply inverse propensity scoring to correct for exposure bias in implicit feedback. Use explicit ratings (e.g., 4+ stars out of 5) as relevance labels when available. Weight implicit signals by engagement depth (listen-through rate, dwell time) rather than binary click, since deep engagement is less affected by popularity bias.
Temporal Drift in Unexpectedness
Cause
The primitive model is trained on historical data and not updated. Over time, user preferences and item popularity shift, causing the primitive model's "expected" items to become stale. Items that were once unexpected become mainstream, and vice versa.
Symptoms
Serendipity scores gradually decrease over months even though the evaluated model has not changed. Alternatively, serendipity appears artificially high because the primitive model is outdated and no longer captures current user expectations.
Mitigation
Retrain the primitive model regularly (at least monthly for active platforms). Use sliding-window popularity for the primitive model rather than all-time popularity. Monitor the staleness of the primitive model by checking its standalone accuracy -- if it drops significantly, it needs retraining.
Placement in an ML System
Where Does Serendipity Sit in the Pipeline?
Serendipity is a metric, not an inference-time component. It lives in the evaluation and monitoring layer, separate from the user-facing recommendation path. Here is the conceptual placement:
Offline evaluation: After training a recommendation model, compute serendipity alongside accuracy metrics (precision, recall, NDCG) and other beyond-accuracy metrics (novelty, diversity, coverage). Serendipity is one dimension of a multi-metric evaluation dashboard.
Model selection: When comparing multiple recommendation algorithms, use serendipity as a secondary criterion alongside accuracy. Two models with similar NDCG but different serendipity should favour the higher-serendipity model, as it provides better user experience.
A/B testing: In production, run the evaluated model against a baseline and measure serendipity on real user interactions. This is the gold standard for serendipity evaluation since it captures genuine user surprise.
Monitoring: Track serendipity over time as a health metric. A declining trend indicates the system is falling into a filter bubble. Set alerts if serendipity drops below a threshold (e.g., < 0.03 with a popularity baseline).
Feedback to exploration policy: If serendipity is too low, feed this signal back to the recommendation strategy. Increase the exploration rate (epsilon in epsilon-greedy), add diversity constraints, or inject serendipity-boosting components (random long-tail items, cross-domain recommendations).
Serendipity never touches the inference path directly. However, the knowledge that serendipity is being measured influences how engineers design the recommendation algorithm -- pushing them toward more exploratory strategies.
Key Insight: Serendipity is to recommendation systems what user satisfaction surveys are to product teams -- a quality signal that goes beyond functional correctness (accuracy) to measure genuine delight. It should be tracked as a first-class metric alongside accuracy, not as an afterthought.
Pipeline Stage
Evaluation / Beyond-Accuracy Metrics
Upstream
- recommendation-engine
- collaborative-filtering
- content-based-filtering
- novelty-metric
- diversity-metric
Downstream
- ab-testing
- model-selection
- monitoring-dashboard
- exploration-policy
Scaling Bottlenecks
Serendipity computation itself is lightweight for the binary (popularity-based) variant: set lookups per user, which is negligible. For users and recommendations each, total cost is -- a few seconds for millions of users on a single CPU.
The content-distance variant is more expensive: per user, where is the history length and is the embedding dimension. For 1 million users with average history length 100 and K=10, this is cosine similarity computations. Use batch matrix multiplication (NumPy/PyTorch) and GPU acceleration to handle this in minutes.
The model-based variant (Ge et al.) requires training the primitive model first, which is the real bottleneck. A user-based KNN on 10 million users takes 1-2 hours on CPU. An ALS model on the same data takes 10-30 minutes on GPU. Budget INR 500-2000 (USD 6-24) per evaluation run on cloud compute.
Just like NDCG, the actual bottleneck is acquiring ground-truth relevance labels. Implicit feedback (clicks, purchases) is free but noisy. Explicit labels cost INR 30-80 per annotation. For a thorough evaluation with 5000 users x 10 recommendations = 50,000 items, expect to spend INR 15-40 lakh for explicit annotations.
Most production systems use implicit feedback with de-biasing techniques (inverse propensity scoring, doubly robust estimators) to keep evaluation costs manageable.
Production Case Studies
Spotify's Discover Weekly playlist is one of the most celebrated serendipity-driven features in consumer technology. Launched in 2015, it generates a personalised 30-song playlist every Monday that aims to surface songs the user has never heard but will love. The system uses a combination of collaborative filtering ("users like you also listened to..."), audio analysis (convolutional neural networks on raw audio spectrograms to detect similar-sounding tracks across genres), and natural language processing (scanning music blogs and reviews for artist associations). The key insight: Discover Weekly deliberately deviates from the user's established taste profile by incorporating songs from adjacent taste clusters, not just the user's primary cluster.
Since launch, users have streamed over 2.3 billion hours of music through Discover Weekly. Spotify reported that the feature increased user engagement and retention significantly. An internal study showed that songs discovered through Discover Weekly were 3x more likely to be saved to a personal playlist than songs found through search, indicating genuine serendipitous value.
Li et al. (2019) conducted a large-scale user study on Taobao (Alibaba's consumer marketplace) to understand how serendipity affects user satisfaction with recommendations. They surveyed over 3,000 users of Taobao's "Guess You Like" personalised homepage, measuring perceived novelty, unexpectedness, relevance, and timeliness of recommendations. The study identified significant causal relationships: novelty and unexpectedness both contribute to perceived serendipity, which in turn drives user satisfaction and purchase intention. Critically, they found that user curiosity moderates the effect -- curious users benefit more from serendipitous recommendations.
The study provided quantitative evidence that serendipity directly increases purchase intention in e-commerce. Users who perceived recommendations as serendipitous were 1.4x more likely to purchase. The findings led Alibaba to incorporate serendipity-aware components into Taobao's recommendation algorithm, particularly for the personalised homepage feed.
Netflix addresses serendipity through its multi-armed bandit approach to recommendation and artwork personalisation. Rather than always showing users content from their dominant genre (e.g., always showing action movies to an action fan), Netflix's exploration strategy deliberately surfaces content from adjacent genres. The artwork personalisation system is a key tool for this: the same movie can be shown with different artwork depending on the user. A comedy-drama might show its dramatic poster to drama fans and its comedic poster to comedy fans, making genre-crossing recommendations feel less unexpected and more approachable. This is serendipity by design -- reducing the perceived unexpectedness of genuinely diverse recommendations.
Netflix reports that personalised artwork increased engagement by 20-30% for recommended titles. More importantly, the exploration strategy helps users discover entire new genres. Netflix's internal metrics show that users who engage with serendipitous cross-genre recommendations have 15% higher long-term retention than users who stay within a single genre bubble.
JioSaavn, India's largest music streaming platform with over 100 million monthly active users, faces a unique serendipity challenge: the Indian music landscape spans 20+ languages, dozens of regional genres, and a massive divide between Bollywood/film music and independent artists. Their recommendation system uses a multi-armed bandit framework to balance exploitation (recommending more Bollywood hits to users who primarily listen to Bollywood) with exploration (introducing regional music, indie artists, and international tracks). The system measures serendipity as the rate at which users engage with recommendations from outside their primary language and genre cluster. Features like "Weekly Discovery" and mood-based playlists are specifically designed to maximise serendipitous encounters across India's diverse musical landscape.
JioSaavn reported that exploration-oriented features increased independent artist streams by 40% and cross-language music discovery by 25% among users who engaged with discovery playlists. The platform's focus on serendipity helps address a key business concern: over-reliance on Bollywood catalogue, which limits opportunities for long-tail monetisation.
Tooling & Ecosystem
Comprehensive Python framework for reproducible recommender systems evaluation. Provides 36+ evaluation metrics across accuracy, coverage, novelty, diversity, bias, and fairness families. While it does not have a built-in serendipity metric per se, its novelty metrics (EPC, EFD) and the ability to compare models against baselines enable serendipity computation. Supports 50+ recommendation algorithms and 13 data splitting strategies.
Unified recommendation library built on PyTorch with 65+ evaluation metrics and 90+ recommendation algorithms. Includes built-in support for popularity-based metrics that serve as primitives for serendipity calculation. Provides standardised data processing and evaluation pipelines. Supports general, sequential, context-aware, and knowledge-based recommendation.
A comparative framework for multimodal recommender systems. Supports beyond-accuracy metrics and provides modular evaluation pipelines. Especially strong for multimodal recommendations (text, images, social networks) where content-distance-based serendipity is relevant. Includes 21+ evaluation metrics.
Simple Python library for building and evaluating recommender systems. Provides collaborative filtering algorithms (KNN, SVD, NMF) that serve well as primitive prediction models for serendipity computation. Does not include serendipity as a built-in metric, but the predicted-rating API makes it easy to implement the Ge et al. variant.
Python toolkit for reproducible recommender systems research. Provides batch recommendation and evaluation pipelines with a focus on reproducibility. Supports custom metric implementations and integrates well with pandas for analysis. Useful for implementing and benchmarking custom serendipity metrics.
Open-source ML monitoring and evaluation platform. Provides recommendation system evaluation dashboards that track accuracy and beyond-accuracy metrics over time. Supports custom metric definitions, making it suitable for monitoring serendipity in production. Integrates with Python-based ML pipelines and CI/CD workflows.
Research & References
Murakami, T., Hirata, K. & Kudo, T. (2008)New Frontiers in Artificial Intelligence (JSAI 2007), Springer LNAI 4914
The foundational paper on serendipity metrics. Introduced the primitive prediction model concept and defined serendipity as unexpectedness (relative to the primitive model) multiplied by relevance. Proposed both list-level and rank-aware variants of the metric. This is the paper that formalized serendipity measurement.
Ge, M., Delgado-Battenfeld, C. & Jannach, D. (2010)ACM Conference on Recommender Systems (RecSys 2010)
Refined the serendipity metric by introducing a continuous unexpectedness score based on the gap between the evaluated model's predicted rating and the primitive model's predicted rating. Also proposed novel coverage metrics. Established the framework used by most subsequent serendipity research.
Zhang, Y. C., Seaghdha, D. O., Quercia, D. & Jambor, T. (2012)ACM International Conference on Web Search and Data Mining (WSDM 2012)
Introduced the Auralist system for serendipitous music recommendation. Combined three components -- relevance (basic collaborative filtering), diversity (listener diversity), and unexpectedness (declustering) -- into a unified framework. Showed that serendipity can be increased without significantly hurting accuracy in music recommendation.
Kotkov, D., Wang, S. & Veijalainen, J. (2016)Knowledge-Based Systems, Vol. 111, pp. 180-192
The most comprehensive survey on serendipity in recommender systems. Catalogues and compares all major serendipity definitions, metrics, and algorithms up to 2016. Identifies the primitive prediction models used in each formulation and discusses the relationship between serendipity, novelty, and diversity. Essential reading for anyone implementing serendipity metrics.
Li, L., Zheng, L., Yang, F. & Li, T. (2019)The Web Conference (WWW 2019)
A landmark large-scale user study (3,000+ users on Taobao) establishing the causal link between serendipity and user satisfaction. Found that novelty and unexpectedness both contribute to perceived serendipity, and serendipity directly increases purchase intention. Showed that user curiosity moderates the serendipity-satisfaction relationship.
McNee, S. M., Riedl, J. & Konstan, J. A. (2006)ACM CHI Conference on Human Factors in Computing Systems (CHI 2006)
The influential position paper that ignited the beyond-accuracy movement in recommender systems. Argued that accuracy metrics alone cannot capture recommendation quality and that metrics like novelty, diversity, and serendipity are essential. While it does not define serendipity formally, it motivated all subsequent serendipity research.
Interview & Evaluation Perspective
Common Interview Questions
- ●
What is serendipity in the context of recommender systems? How is it different from novelty?
- ●
How would you measure serendipity for a music recommendation system?
- ●
What is a primitive prediction model, and why is it needed for serendipity?
- ●
How do you balance serendipity with accuracy? What is the tradeoff?
- ●
Your recommendation system has high precision but users report getting bored. What metric would you look at, and how would you improve it?
- ●
How would you design an A/B test to measure whether a new algorithm improves serendipity?
- ●
Can you optimise for serendipity directly during training? If not, how do you improve it?
Key Points to Mention
- ●
Serendipity = unexpectedness x relevance. Both components are required: unexpected but irrelevant is noise, relevant but expected is boring. Only items that satisfy both conditions are serendipitous.
- ●
The primitive prediction model defines 'expected': a simple baseline (popularity, KNN, content-based) that captures obvious recommendations. The choice of primitive model is the most important design decision.
- ●
Serendipity is inherently in tension with accuracy. Improving serendipity by 10% typically costs 2-5% in precision. The right balance depends on the domain and user expectations.
- ●
Offline serendipity systematically underestimates true serendipity because test data only contains items users already discovered. Always validate with online A/B tests.
- ●
Serendipity is one of four beyond-accuracy metrics (alongside novelty, diversity, and coverage). A healthy recommendation system monitors all four, not just accuracy.
- ●
Practical serendipity scores with a popularity baseline typically range from 0.03 to 0.15. Above 0.20 is suspicious (primitive model too weak). Below 0.03 suggests filter bubble.
Pitfalls to Avoid
- ●
Confusing serendipity with novelty -- novelty only requires newness, serendipity requires both surprise and relevance. Saying 'serendipity is just recommending new items' is incorrect.
- ●
Claiming you can compute serendipity without defining a primitive model -- the unexpectedness component requires a baseline to compare against. Without it, 'unexpected' is undefined.
- ●
Suggesting you would maximise serendipity as the sole objective -- this leads to random recommendations. Serendipity is a secondary metric alongside accuracy.
- ●
Ignoring the offline-online gap -- reporting offline serendipity improvements without mentioning the need for online validation shows limited practical experience.
- ●
Not discussing the tension between serendipity and business metrics -- in e-commerce, too much serendipity can reduce conversion rate. In media, it can increase churn. The right level is domain-specific.
Senior-Level Expectation
A senior candidate should demonstrate end-to-end thinking about serendipity: why it matters (filter bubbles, user satisfaction, catalogue utilisation), how to measure it (primitive model design, relevance labels, aggregation), where it fits in the evaluation pipeline (alongside accuracy and other beyond-accuracy metrics), how to improve it (exploration strategies, diversity constraints, cross-domain recommendations), and how to validate improvements (A/B testing design, user surveys, long-term retention analysis). They should discuss the cold-start problem (serendipity is hard to measure for new users), temporal dynamics (staleness of the primitive model), and the economic argument (serendipity drives long-tail monetisation). A staff-level candidate might discuss how to build serendipity into the recommendation objective (multi-objective optimisation, constrained optimisation, reinforcement learning with serendipity rewards) and how serendipity measurement changes with LLM-based recommenders.
Summary
Let's recap the key points about the serendipity metric:
Serendipity = Unexpectedness x Relevance. It measures the fraction of recommendations that are both surprising (not what a simple baseline would suggest) and valuable (the user actually likes them). This dual requirement makes it the strictest of the beyond-accuracy metrics and the most direct measure of "pleasant surprise" in recommendation systems.
The primitive prediction model is the cornerstone of serendipity measurement. It defines what counts as "expected" -- typically the top-K popular items, a content-based baseline, or a simple collaborative filter. Any recommendation the sophisticated model makes that the primitive model would NOT have made is "unexpected." Among those unexpected items, the ones the user engages with positively are serendipitous. The choice of primitive model changes scores dramatically, so always report it.
Serendipity addresses the filter bubble problem -- the tendency of accuracy-optimised systems to show users increasingly narrow, predictable recommendations. A system with zero serendipity is a perfect echo chamber. A system with healthy serendipity (0.05-0.15 with a popularity baseline) actively expands user horizons while maintaining relevance. Research from Alibaba (Taobao), Spotify (Discover Weekly), and Netflix shows that serendipitous recommendations increase long-term user satisfaction, retention, and platform engagement, even if they slightly reduce short-term accuracy.
Key tradeoffs: Serendipity is in tension with accuracy (improving one typically costs the other); it requires relevance labels (expensive to collect); it lacks standard library implementations; and offline evaluation systematically underestimates true serendipity. Despite these challenges, serendipity is essential for any recommendation system that aims for long-term user satisfaction rather than just short-term click optimisation. Track it alongside accuracy, novelty, diversity, and coverage for a complete picture of recommendation quality.
Serendipity is what separates a recommendation system that mirrors user history from one that genuinely helps users discover things they did not know they wanted. If you are building recommendations, measure it.