Load Balancer in Machine Learning
A load balancer in ML systems is the traffic controller that distributes inference requests across multiple model replicas, GPU workers, or serving instances to maximize throughput, minimize latency, and ensure high availability. Without one, a single overloaded replica becomes a bottleneck while other replicas sit idle -- the classic hot-spot problem.
Unlike traditional web load balancing, ML inference load balancing introduces unique challenges: GPU memory is finite and expensive, model warm-up times are non-trivial, request processing times vary wildly depending on input size (a 10-token prompt vs. a 4,000-token prompt can differ by 100x in compute), and stateful resources like KV caches create affinity requirements that simple round-robin cannot handle.
In production ML systems -- from Flipkart's real-time recommendation engine to Google's Vertex AI serving infrastructure -- the load balancer sits at the critical path between the API gateway and the model servers. It determines not just whether a request succeeds, but how fast and how efficiently it succeeds. Get this wrong, and you're either wasting GPU cycles (expensive: an A100 costs ~$2/hour or ~INR 168/hour on cloud) or dropping requests under load.
This guide covers everything from classical algorithms (round-robin, least connections) to modern ML-specific strategies (KV cache-aware routing, GPU utilization-based scheduling, adaptive batching), along with production tooling, failure modes, and real-world case studies.
Concept Snapshot
- What It Is
- A network component that distributes incoming ML inference requests across multiple model replicas or GPU workers to optimize throughput, latency, and resource utilization.
- Category
- Deployment
- Complexity
- Intermediate
- Inputs / Outputs
- Inputs: client inference requests (HTTP/gRPC) with model payloads. Outputs: routed requests to selected backend replica, aggregated responses back to clients.
- System Placement
- Sits between the API gateway or client and the model serving instances (e.g., Triton, vLLM, TorchServe) in the serving layer of an ML pipeline.
- Also Known As
- inference router, request dispatcher, traffic distributor, inference gateway, model router, serving proxy
- Typical Users
- ML Platform Engineers, MLOps Engineers, Site Reliability Engineers, Infrastructure Engineers, DevOps Engineers
- Prerequisites
- Basic networking (HTTP, gRPC, TCP), Model serving concepts (replicas, endpoints), Kubernetes fundamentals (pods, services, ingress), GPU resource management basics
- Key Terms
- round-robinleast connectionsweighted routinghealth checksconsistent hashingKV cache affinityadaptive batchingtraffic splittingcircuit breakerbackpressure
Why This Concept Exists
The Problem: GPU Replicas Are Expensive and Heterogeneous
Deploying an ML model in production typically means running multiple replicas of the same model on GPU-equipped servers. An NVIDIA A100 80GB instance on AWS (p4d.24xlarge) costs approximately $32.77/hour (~INR 2,750/hour). At that price, you cannot afford idle replicas, nor can you afford overloaded replicas dropping requests while others wait. The load balancer's job is to ensure every GPU-dollar is working.
But here's the catch: ML inference is fundamentally different from web serving. A traditional web request might take 5-50ms regardless of content. An LLM inference request can take anywhere from 50ms (short completion) to 30 seconds (long generation with chain-of-thought), depending on input length, output length, model size, and batch composition. This variance makes naive load balancing algorithms like round-robin dangerously inadequate.
The Evolution: From Static to Intelligent Routing
Early ML serving systems borrowed load balancing directly from web infrastructure -- Nginx or HAProxy with round-robin or least-connections. This worked reasonably well for models with predictable latency (image classification, tabular models) where every request takes roughly the same time.
The shift to large language models changed everything. With autoregressive generation, a single request can hold a GPU for seconds while accumulating a KV cache that represents significant compute investment. If that request gets routed to a different replica on retry, the KV cache is lost, and the work is wasted.
This drove the development of ML-aware load balancing -- systems that understand GPU utilization, KV cache state, batch queue depth, and model-specific characteristics. Google's GKE Inference Gateway, the Kubernetes Gateway API Inference Extension, NVIDIA's Dynamo router, and vLLM's built-in router all emerged from this need.
Why Not Just Auto-Scale?
Auto-scaling and load balancing are complementary, not substitutes. Auto-scaling adjusts the number of replicas; load balancing optimizes how requests are distributed across existing replicas. Even with perfect auto-scaling, poor load balancing causes hot spots, wasted KV cache, and tail latency spikes. And auto-scaling has a critical lag -- spinning up a new GPU instance takes 2-10 minutes on most cloud providers, during which the load balancer is the only defense against overload.
Key Takeaway: Load balancing for ML inference exists because GPU resources are expensive and heterogeneous, inference latency is highly variable, and stateful resources (KV caches, batch queues) create routing constraints that traditional web load balancers were never designed to handle.
Core Intuition & Mental Model
The Mental Model: Air Traffic Control
Think of a load balancer as an air traffic controller for inference requests. Each GPU replica is a runway. Requests are incoming aircraft. The controller's job is to assign each aircraft to a runway such that no runway is congested, no aircraft circles indefinitely, and the overall throughput of the airport is maximized.
Now imagine that some aircraft are small single-engine planes (short prompts) and others are Boeing 747s (long generation tasks). A 747 blocks the runway for much longer. If you blindly alternate between runways (round-robin), you might send three 747s to Runway A and three Cessnas to Runway B -- Runway A is backed up for minutes while Runway B is idle within seconds. This is exactly what happens with naive load balancing on LLM inference.
The Core Tradeoff: Simplicity vs. Optimality
Every load balancing algorithm sits on a spectrum between two extremes:
- Simple and stateless (round-robin, random): Zero coordination overhead, but oblivious to backend state. Works fine when requests are uniform.
- Complex and state-aware (GPU utilization-based, KV cache-aware): Requires real-time telemetry from backends, but can make globally optimal routing decisions.
The art of production load balancing is choosing the simplest algorithm that meets your requirements. Don't build a KV cache-aware router if your model serves 100 requests per minute with uniform latency. But don't use round-robin if you're serving an LLM at 10,000 QPS with 100x latency variance.
What Load Balancing Does NOT Do
The load balancer distributes traffic; it does not fix a slow model. If your model takes 5 seconds per inference on every replica, the load balancer can ensure all replicas share the load equally, but it cannot make any individual request faster. The load balancer optimizes the system-level metrics (aggregate throughput, tail latency, utilization) not the per-request compute time.
Rule of Thumb: If your P50 latency is fine but your P99 is 10x worse, the problem is likely load balancing or queuing. If both P50 and P99 are slow, the problem is the model or hardware itself.
Technical Foundations
Mathematical Formulation
Let us define the load balancing problem for ML inference formally.
Given a set of model replicas , each with a processing capacity (requests per second) and a current queue depth , and a stream of incoming inference requests with arrival rate , the load balancer assigns each incoming request to a replica where is the routing function.
Objective
The optimal routing function minimizes the expected response time across all requests:
where is the total response time (queue wait + processing) for request on replica , and is the total number of requests.
Classical Algorithms
Round-Robin: . Distributes requests cyclically. Optimal only when all replicas have identical capacity and all requests have identical processing time.
Weighted Round-Robin: Replica receives a fraction of traffic proportional to its weight : . Useful for heterogeneous GPU configurations (e.g., mixing A100 and T4 replicas).
Least Connections: . Routes to the replica with the fewest active requests. Better for variable-latency workloads but requires real-time connection tracking.
Least Response Time: where is the estimated response time based on recent observations. Approximates the optimal solution but requires latency telemetry.
ML-Specific Extensions
GPU Utilization-Aware Routing: where is the current GPU utilization of replica . Requires metrics export from the model server (e.g., NVIDIA DCGM exporter).
KV Cache-Aware Routing (for LLMs): For a request with a prefix , the router computes a hash and routes to the replica most likely to have the prefix cached:
This is often implemented via consistent hashing with bounded loads (CHWBL), where the hash ring maps prefixes to replicas while enforcing a maximum load bound per replica, with being the average load and typically set to 0.25.
Stability Condition
For the system to be stable (finite queue depths), the aggregate arrival rate must be strictly less than the aggregate processing capacity:
When this condition is violated, no load balancing algorithm can prevent unbounded queue growth -- you need to scale out (add replicas) or shed load (rate limiting).
Internal Architecture
A production ML inference load balancer typically operates as a reverse proxy layer between the API gateway and the model serving backends. The architecture can be centralized (a dedicated proxy like Envoy or Nginx) or distributed (sidecar proxies in a service mesh like Istio). Modern ML-specific implementations add telemetry-driven routing decisions based on GPU metrics, queue depth, and cache state.
The load balancer receives inference requests, consults health check status and backend telemetry, selects a target replica using the configured algorithm, forwards the request, and returns the response. Unhealthy replicas are automatically removed from the rotation. In Kubernetes environments, this is typically implemented as an Ingress controller (Nginx Ingress, Envoy Gateway) or a Gateway API resource with custom inference-aware extensions.
Key Components
Request Receiver (Frontend Listener)
Accepts incoming HTTP/gRPC inference requests from clients or the API gateway. Handles TLS termination, request parsing, and protocol translation (e.g., HTTP/2 to HTTP/1.1). In Envoy, this is the listener and filter chain.
Routing Engine (Load Balancing Algorithm)
The decision-making core. Implements the configured algorithm (round-robin, least connections, weighted, consistent hashing, or custom ML-aware logic) to select a target backend for each request. May consult real-time telemetry like GPU utilization, KV cache hit ratios, or pending batch size.
Health Checker
Continuously probes backend replicas via HTTP health endpoints (e.g., /v2/health/ready for Triton) or TCP checks. Removes unhealthy replicas from the pool and reintroduces them after recovery. Supports both active (periodic probes) and passive (failure-based) health checking.
Backend Pool Manager
Maintains the registry of available model replicas, their weights, addresses, and metadata (GPU type, model version, supported batch sizes). In Kubernetes, this integrates with Endpoints or EndpointSlices for dynamic discovery as pods scale up or down.
Telemetry Collector
Gathers real-time metrics from backend replicas: GPU utilization (via DCGM), queue depth, active connections, KV cache utilization, batch fill ratio. Feeds these signals to the routing engine for informed decisions. Implemented via Prometheus scraping, gRPC streaming, or custom metrics endpoints.
Circuit Breaker & Rate Limiter
Protects backend replicas from overload. The circuit breaker opens when error rates exceed a threshold, temporarily removing a replica from rotation. The rate limiter enforces per-client or global request rate caps. Both prevent cascade failures when a model replica becomes slow or unresponsive.
Traffic Splitter (for A/B & Canary)
Routes configurable percentages of traffic to different model versions for A/B testing or canary deployments. For example, 95% to the production model (v2) and 5% to the canary (v3). Supports header-based, cookie-based, or random assignment for consistent user experiences.
Data Flow
Request Path: A client sends an inference request (e.g., POST /v1/completions) -> the load balancer's frontend listener accepts it -> the routing engine evaluates backend health, current load, and optionally GPU/cache metrics -> a target replica is selected -> the request is forwarded via HTTP/gRPC -> the replica processes the request and returns a response -> the load balancer relays the response to the client.
Health Check Path (parallel): The health checker sends periodic probes (every 5-10s) to each replica's health endpoint -> healthy replicas remain in the pool, failed replicas are marked as unhealthy and removed -> after a configurable number of consecutive successes (e.g., 3), recovered replicas rejoin the pool.
Telemetry Path (parallel): Backend replicas expose GPU utilization, queue depth, and KV cache metrics via Prometheus endpoints or custom APIs -> the telemetry collector scrapes these at regular intervals (1-5s) -> the routing engine uses fresh telemetry data to make routing decisions.
Traffic Split Path (when A/B testing or canary is active): The traffic splitter intercepts requests before the routing engine -> evaluates traffic rules (percentage split, header match, user cohort) -> routes to the appropriate model version cluster -> within that cluster, the routing engine distributes across replicas normally.
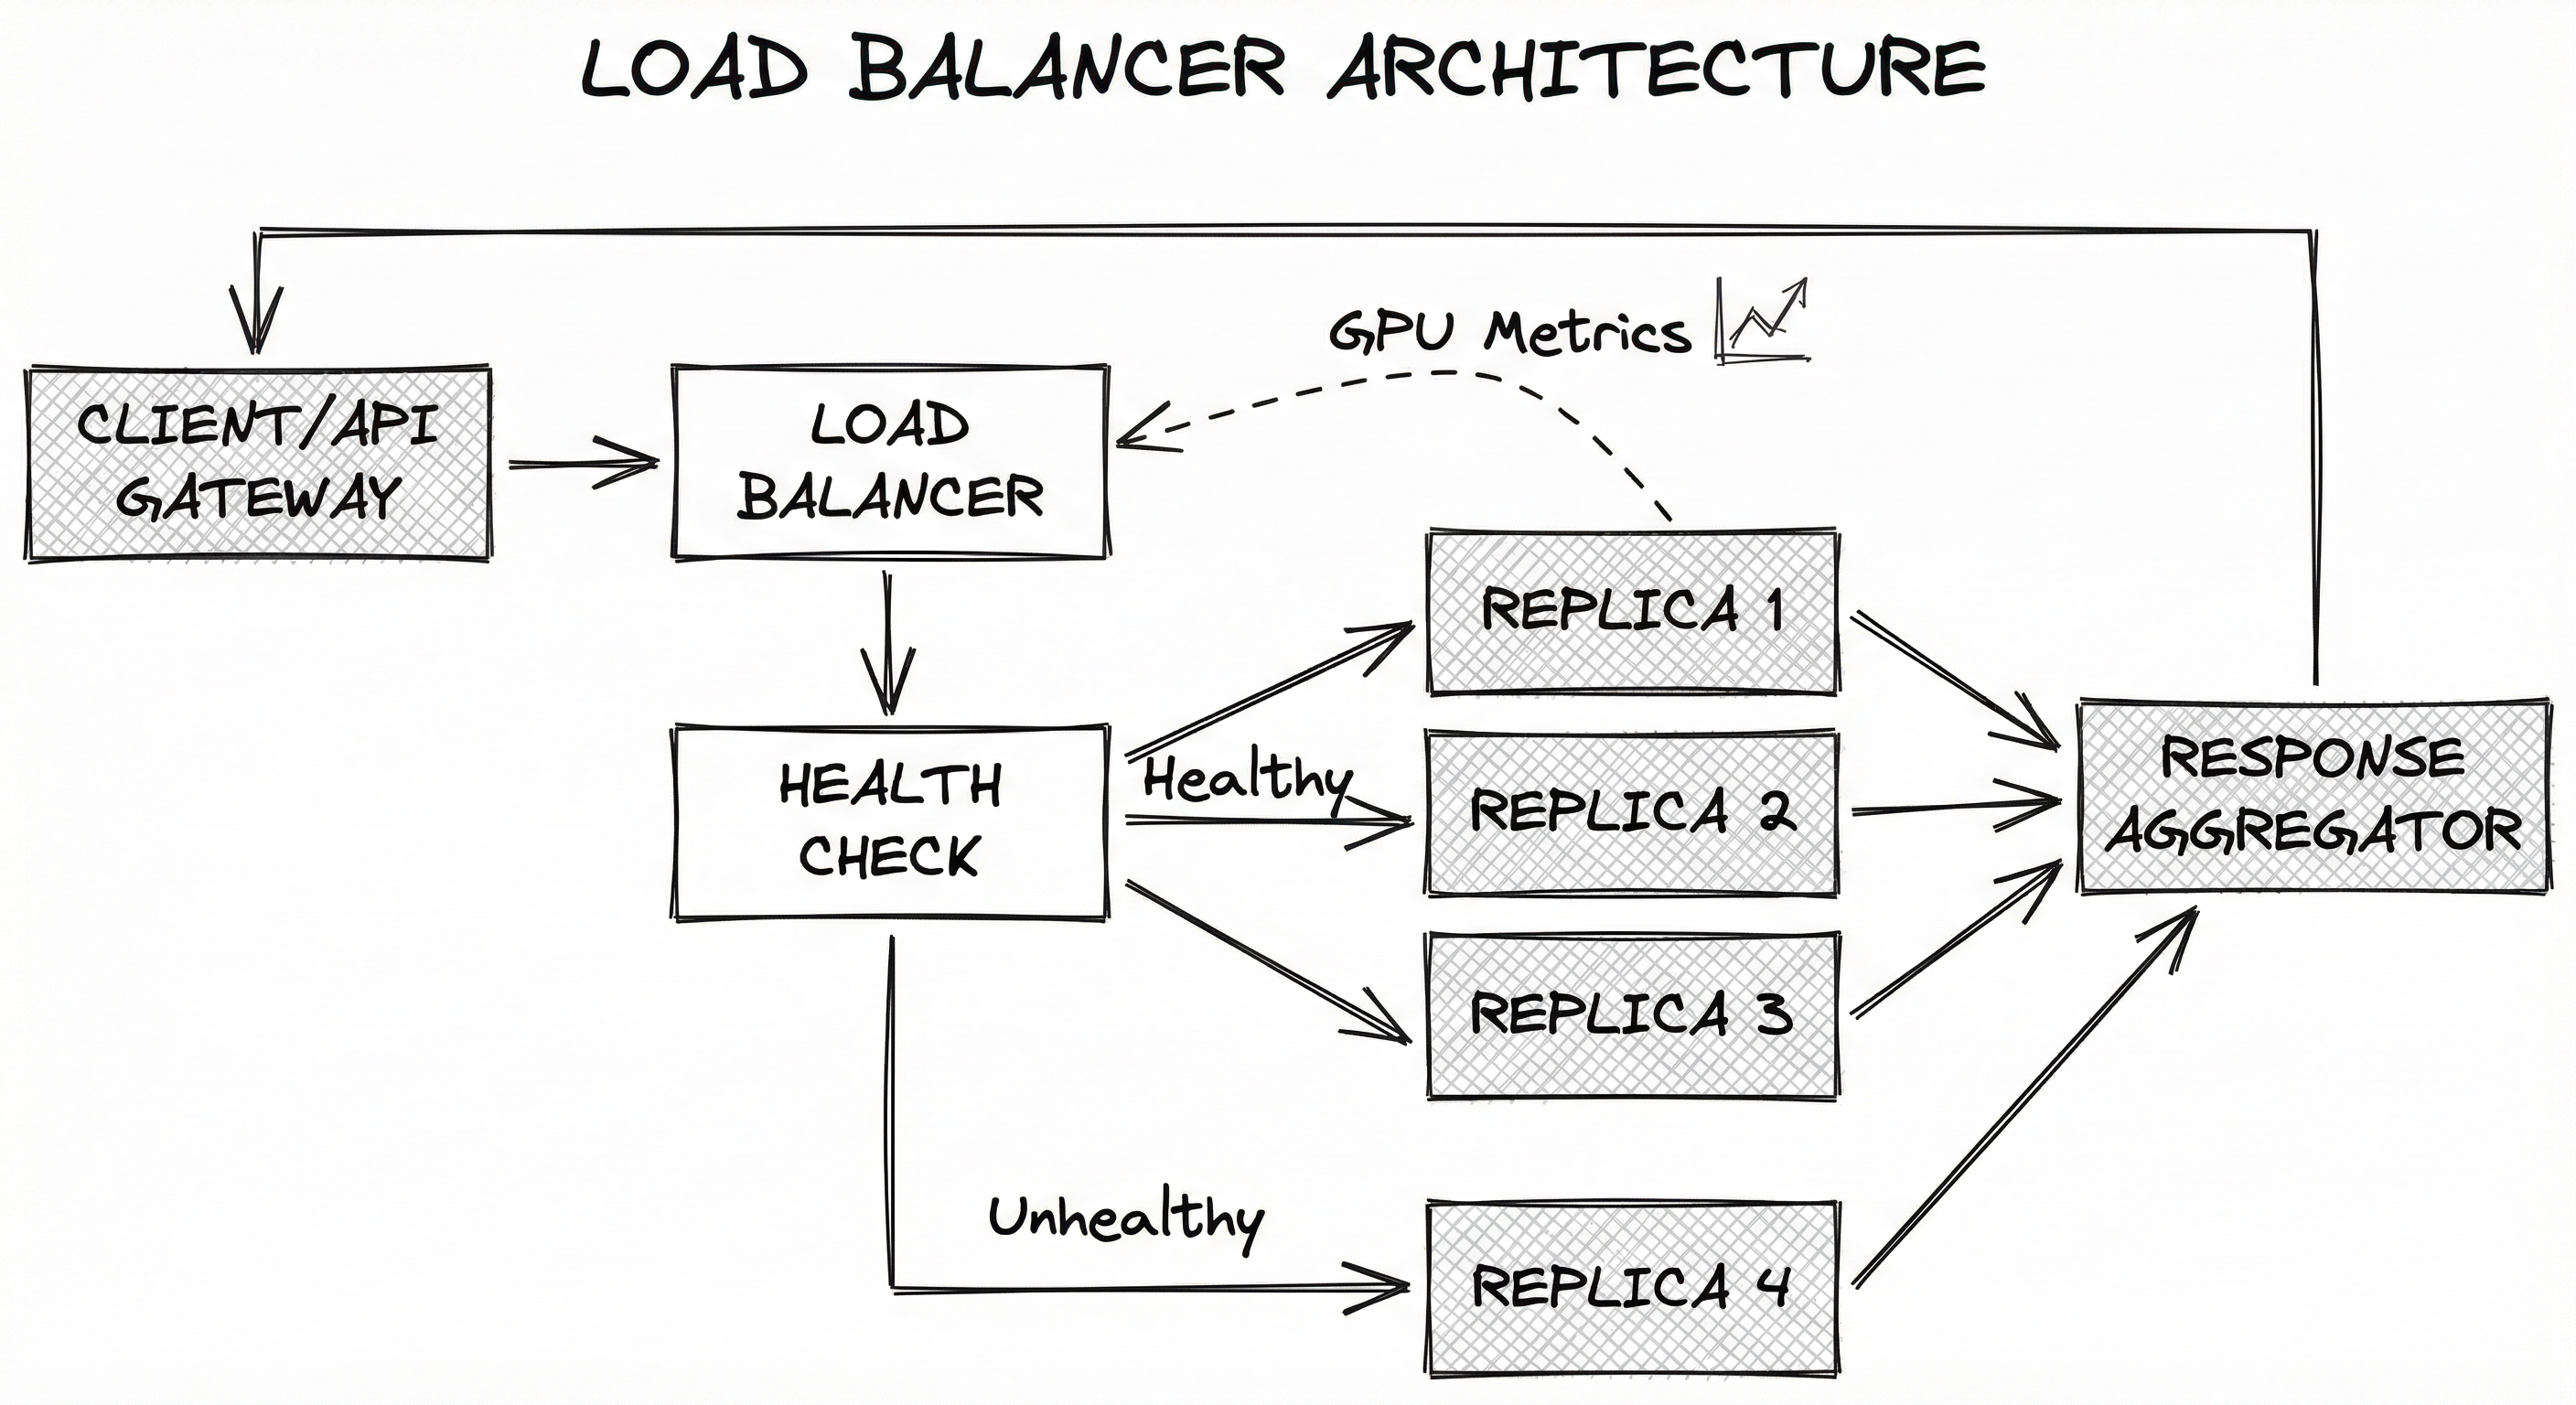
A directed flow from Client/API Gateway to Load Balancer, which connects to a Health Check decision point. Healthy replicas (1, 2, 3) receive forwarded requests; an unhealthy replica (4) is excluded. All healthy replicas feed responses back through a Response Aggregator to the Client. A dashed line shows GPU Metrics and Queue Depth telemetry feeding back to the Load Balancer for informed routing decisions.
How to Implement
Choosing an Implementation Strategy
Implementation patterns for ML inference load balancing fall into three tiers:
Tier 1: Generic reverse proxy (Nginx, HAProxy, Envoy). These are battle-tested, high-performance proxies that handle millions of requests per second. They support standard algorithms (round-robin, least connections, IP hash) and basic health checks. Best for models with uniform latency profiles -- image classification, tabular prediction, embedding generation. Cost: free (open-source). Setup: hours.
Tier 2: Kubernetes-native ingress (Nginx Ingress Controller, Envoy Gateway, Istio/Envoy sidecar mesh). These integrate with Kubernetes service discovery, auto-scaling, and traffic management. They add features like traffic splitting for canary deployments, header-based routing, and circuit breaking. Best for teams already on Kubernetes who need more control than a bare Service object provides. Cost: free (open-source) + Kubernetes operational overhead. Setup: days.
Tier 3: ML-aware inference gateway (GKE Inference Gateway, vLLM Router, KServe with Knative, NVIDIA Dynamo). These are purpose-built for ML inference, incorporating GPU telemetry, KV cache awareness, batch-aware routing, and model-version-specific traffic splits. Best for LLM serving at scale where standard proxies leave significant performance on the table. Cost: varies (some vendor-specific). Setup: days to weeks.
Cost Guidance for Indian Teams: If you're deploying on AWS Mumbai (ap-south-1) or GCP Mumbai (asia-south1), a Kubernetes cluster with Nginx Ingress Controller is the most cost-effective starting point. An EKS cluster costs ~0.085/hour, ~INR 7.1/hour) will handle it fine.
upstream ml_model_pool {
    # Weighted routing: A100 replicas get more traffic than T4
    server model-replica-1:8080 weight=5;  # A100 GPU
    server model-replica-2:8080 weight=5;  # A100 GPU
    server model-replica-3:8080 weight=2;  # T4 GPU
    server model-replica-4:8080 weight=2;  # T4 GPU

    # Least connections for variable-latency ML inference
    least_conn;

    # Passive health checks
    # Mark as failed after 3 errors within 30s, retry after 30s
    server model-replica-1:8080 weight=5 max_fails=3 fail_timeout=30s;
    server model-replica-2:8080 weight=5 max_fails=3 fail_timeout=30s;
    server model-replica-3:8080 weight=2 max_fails=3 fail_timeout=30s;
    server model-replica-4:8080 weight=2 max_fails=3 fail_timeout=30s;
}

server {
    listen 443 ssl;
    server_name inference.example.com;

    ssl_certificate     /etc/nginx/ssl/cert.pem;
    ssl_certificate_key /etc/nginx/ssl/key.pem;

    location /v1/predict {
        proxy_pass http://ml_model_pool;

        # Timeout tuned for ML inference (longer than web)
        proxy_connect_timeout 5s;
        proxy_read_timeout 120s;  # LLM generation can take time
        proxy_send_timeout 30s;

        # Retry on connection errors but NOT on 5xx
        # (5xx from model server may mean input error, not replica failure)
        proxy_next_upstream error timeout;
        proxy_next_upstream_tries 2;

        # Headers for tracing
        proxy_set_header X-Request-ID $request_id;
        proxy_set_header X-Real-IP $remote_addr;
        proxy_set_header Host $host;
    }

    # Health check endpoint (Nginx Plus only for active checks)
    location /health {
        proxy_pass http://ml_model_pool/v2/health/ready;
    }
}
This Nginx configuration demonstrates weighted least-connections load balancing for a heterogeneous GPU fleet. A100 replicas receive weight=5 while T4 replicas receive weight=2, reflecting their ~2.5x difference in inference throughput. The least_conn directive ensures requests go to the replica with the fewest active connections -- critical for variable-latency ML workloads. Passive health checks mark replicas as failed after 3 errors within 30 seconds. The proxy_read_timeout is set to 120 seconds to accommodate long LLM generation tasks.
static_resources:
  listeners:
    - name: inference_listener
      address:
        socket_address:
          address: 0.0.0.0
          port_value: 8443
      filter_chains:
        - filters:
            - name: envoy.filters.network.http_connection_manager
              typed_config:
                "@type": type.googleapis.com/envoy.extensions.filters.network.http_connection_manager.v3.HttpConnectionManager
                stat_prefix: inference_gateway
                codec_type: AUTO
                route_config:
                  name: local_route
                  virtual_hosts:
                    - name: ml_inference
                      domains: ["*"]
                      routes:
                        # Route to canary for 5% of traffic
                        - match:
                            prefix: "/inference.ModelService/"
                            runtime_fraction:
                              default_value:
                                numerator: 5
                                denominator: HUNDRED
                          route:
                            cluster: model_canary_v2
                        # Remaining 95% to stable
                        - match:
                            prefix: "/inference.ModelService/"
                          route:
                            cluster: model_stable_v1
                            timeout: 120s
                http_filters:
                  - name: envoy.filters.http.router
                    typed_config:
                      "@type": type.googleapis.com/envoy.extensions.filters.http.router.v3.Router

  clusters:
    - name: model_stable_v1
      connect_timeout: 5s
      type: STRICT_DNS
      lb_policy: LEAST_REQUEST
      load_assignment:
        cluster_name: model_stable_v1
        endpoints:
          - lb_endpoints:
              - endpoint:
                  address:
                    socket_address:
                      address: model-v1-svc
                      port_value: 8001
      health_checks:
        - timeout: 3s
          interval: 10s
          unhealthy_threshold: 3
          healthy_threshold: 2
          http_health_check:
            path: "/v2/health/ready"
      circuit_breakers:
        thresholds:
          - max_connections: 1024
            max_pending_requests: 512
            max_requests: 2048
            max_retries: 3

    - name: model_canary_v2
      connect_timeout: 5s
      type: STRICT_DNS
      lb_policy: LEAST_REQUEST
      load_assignment:
        cluster_name: model_canary_v2
        endpoints:
          - lb_endpoints:
              - endpoint:
                  address:
                    socket_address:
                      address: model-v2-svc
                      port_value: 8001
      health_checks:
        - timeout: 3s
          interval: 10s
          unhealthy_threshold: 3
          healthy_threshold: 2
          http_health_check:
            path: "/v2/health/ready"
This Envoy configuration demonstrates two key ML inference patterns: canary traffic splitting (5% to v2, 95% to v1) and gRPC-native load balancing with active health checks. The LEAST_REQUEST policy (Envoy's least-connections variant) routes each request to the replica with the fewest active requests. Active health checks probe /v2/health/ready (the standard Triton/KServe health endpoint) every 10 seconds. Circuit breakers prevent cascading failures by capping concurrent connections and pending requests per cluster.
import asyncio
import httpx
import random
from dataclasses import dataclass, field
from typing import Optional
from fastapi import FastAPI, Request, HTTPException
from fastapi.responses import StreamingResponse
import time


@dataclass
class ModelReplica:
    """Represents a single model serving replica."""
    url: str
    gpu_type: str
    weight: float = 1.0
    active_requests: int = 0
    gpu_utilization: float = 0.0
    kv_cache_usage: float = 0.0
    is_healthy: bool = True
    last_health_check: float = 0.0
    consecutive_failures: int = 0
    avg_latency_ms: float = 0.0
    _latency_window: list = field(default_factory=list)

    def record_latency(self, latency_ms: float):
        self._latency_window.append(latency_ms)
        if len(self._latency_window) > 100:
            self._latency_window.pop(0)
        self.avg_latency_ms = sum(self._latency_window) / len(self._latency_window)


class MLLoadBalancer:
    """GPU-aware load balancer for ML inference replicas."""

    def __init__(self, replicas: list[ModelReplica], algorithm: str = "least_loaded"):
        self.replicas = replicas
        self.algorithm = algorithm
        self.client = httpx.AsyncClient(timeout=120.0)

    def _score_replica(self, replica: ModelReplica) -> float:
        """Score a replica (lower is better). Combines multiple signals."""
        if not replica.is_healthy:
            return float('inf')

        # Weighted combination of signals
        queue_score = replica.active_requests / max(replica.weight, 0.1)
        gpu_score = replica.gpu_utilization
        cache_score = replica.kv_cache_usage  # High cache = less room
        latency_score = replica.avg_latency_ms / 1000.0  # Normalize

        # Composite score: prioritize queue depth, then GPU util
        return (0.4 * queue_score +
                0.3 * gpu_score +
                0.2 * cache_score +
                0.1 * latency_score)

    def select_replica(self) -> Optional[ModelReplica]:
        """Select the best replica based on the configured algorithm."""
        healthy = [r for r in self.replicas if r.is_healthy]
        if not healthy:
            return None

        if self.algorithm == "round_robin":
            # Simple round-robin (stateful counter)
            if not hasattr(self, '_rr_idx'):
                self._rr_idx = 0
            self._rr_idx = (self._rr_idx + 1) % len(healthy)
            return healthy[self._rr_idx]

        elif self.algorithm == "least_connections":
            return min(healthy, key=lambda r: r.active_requests)

        elif self.algorithm == "weighted_random":
            weights = [r.weight for r in healthy]
            return random.choices(healthy, weights=weights, k=1)[0]

        elif self.algorithm == "least_loaded":
            # GPU-aware: composite scoring
            return min(healthy, key=self._score_replica)

        raise ValueError(f"Unknown algorithm: {self.algorithm}")

    async def forward_request(self, replica: ModelReplica, request: Request) -> httpx.Response:
        """Forward an inference request to the selected replica."""
        replica.active_requests += 1
        start = time.monotonic()
        try:
            body = await request.body()
            response = await self.client.post(
                f"{replica.url}{request.url.path}",
                content=body,
                headers={"Content-Type": request.headers.get("content-type", "application/json")},
            )
            latency_ms = (time.monotonic() - start) * 1000
            replica.record_latency(latency_ms)
            replica.consecutive_failures = 0
            return response
        except Exception as e:
            replica.consecutive_failures += 1
            if replica.consecutive_failures >= 3:
                replica.is_healthy = False
            raise
        finally:
            replica.active_requests -= 1

    async def health_check_loop(self, interval: float = 10.0):
        """Periodic health checks for all replicas."""
        while True:
            for replica in self.replicas:
                try:
                    resp = await self.client.get(
                        f"{replica.url}/v2/health/ready", timeout=3.0
                    )
                    replica.is_healthy = resp.status_code == 200
                    if replica.is_healthy:
                        replica.consecutive_failures = 0
                except Exception:
                    replica.consecutive_failures += 1
                    if replica.consecutive_failures >= 3:
                        replica.is_healthy = False
                replica.last_health_check = time.monotonic()
            await asyncio.sleep(interval)

    async def metrics_scrape_loop(self, interval: float = 5.0):
        """Scrape GPU metrics from replicas (assumes Prometheus format)."""
        while True:
            for replica in self.replicas:
                if not replica.is_healthy:
                    continue
                try:
                    resp = await self.client.get(
                        f"{replica.url}/metrics", timeout=2.0
                    )
                    # Parse GPU utilization from Prometheus metrics
                    for line in resp.text.split("\n"):
                        if "gpu_utilization" in line and not line.startswith("#"):
                            replica.gpu_utilization = float(line.split()[-1])
                        if "kv_cache_usage" in line and not line.startswith("#"):
                            replica.kv_cache_usage = float(line.split()[-1])
                except Exception:
                    pass  # Metrics scrape failure is non-fatal
            await asyncio.sleep(interval)


# --- FastAPI Application ---
app = FastAPI(title="ML Inference Load Balancer")

replicas = [
    ModelReplica(url="http://model-0:8000", gpu_type="A100", weight=5.0),
    ModelReplica(url="http://model-1:8000", gpu_type="A100", weight=5.0),
    ModelReplica(url="http://model-2:8000", gpu_type="T4", weight=2.0),
]
lb = MLLoadBalancer(replicas, algorithm="least_loaded")


@app.on_event("startup")
async def startup():
    asyncio.create_task(lb.health_check_loop(interval=10.0))
    asyncio.create_task(lb.metrics_scrape_loop(interval=5.0))


@app.post("/v1/predict")
async def predict(request: Request):
    replica = lb.select_replica()
    if replica is None:
        raise HTTPException(status_code=503, detail="No healthy replicas available")
    try:
        response = await lb.forward_request(replica, request)
        return response.json()
    except Exception as e:
        raise HTTPException(status_code=502, detail=f"Replica error: {str(e)}")
This is a complete, runnable GPU-aware load balancer built with FastAPI. The MLLoadBalancer class implements four algorithms: round-robin, least connections, weighted random, and least-loaded (the GPU-aware option). The least_loaded algorithm computes a composite score from active request count, GPU utilization, KV cache usage, and recent average latency -- a practical approximation of the ML-specific routing strategies used in production systems like GKE Inference Gateway. Background tasks handle periodic health checks and GPU metrics scraping from each replica's Prometheus endpoint.
# Gateway API resources for ML inference load balancing
apiVersion: gateway.networking.k8s.io/v1
kind: Gateway
metadata:
  name: inference-gateway
  namespace: ml-serving
spec:
  gatewayClassName: envoy
  listeners:
    - name: https
      protocol: HTTPS
      port: 443
      tls:
        mode: Terminate
        certificateRefs:
          - name: inference-tls-cert
---
apiVersion: gateway.networking.k8s.io/v1
kind: HTTPRoute
metadata:
  name: model-route
  namespace: ml-serving
spec:
  parentRefs:
    - name: inference-gateway
  hostnames:
    - "inference.mycompany.com"
  rules:
    # Canary: 5% to v2, 95% to v1
    - matches:
        - path:
            type: PathPrefix
            value: /v1/predict
      backendRefs:
        - name: model-v1-svc
          port: 8080
          weight: 95
        - name: model-v2-svc
          port: 8080
          weight: 5
    # Health endpoint
    - matches:
        - path:
            type: Exact
            value: /healthz
      backendRefs:
        - name: model-v1-svc
          port: 8080
---
apiVersion: v1
kind: Service
metadata:
  name: model-v1-svc
  namespace: ml-serving
spec:
  selector:
    app: model-server
    version: v1
  ports:
    - port: 8080
      targetPort: 8080
      protocol: TCP
---
apiVersion: apps/v1
kind: Deployment
metadata:
  name: model-v1
  namespace: ml-serving
spec:
  replicas: 3
  selector:
    matchLabels:
      app: model-server
      version: v1
  template:
    metadata:
      labels:
        app: model-server
        version: v1
    spec:
      containers:
        - name: model-server
          image: nvcr.io/nvidia/tritonserver:24.08-py3
          ports:
            - containerPort: 8080
          resources:
            limits:
              nvidia.com/gpu: 1
          readinessProbe:
            httpGet:
              path: /v2/health/ready
              port: 8080
            initialDelaySeconds: 30
            periodSeconds: 10
          livenessProbe:
            httpGet:
              path: /v2/health/live
              port: 8080
            initialDelaySeconds: 60
            periodSeconds: 30
This Kubernetes manifest demonstrates the Gateway API pattern for ML inference load balancing with canary traffic splitting. The HTTPRoute distributes traffic: 95% to model-v1-svc and 5% to model-v2-svc. Each model deployment runs Triton Inference Server on a GPU node with readiness and liveness probes for automatic health-based routing. Kubernetes' built-in service load balancing (iptables/IPVS) distributes traffic across pods within each service. This is the production pattern used by teams deploying on GKE, EKS, or AKS.
# Istio VirtualService for ML model traffic management
apiVersion: networking.istio.io/v1beta1
kind: VirtualService
metadata:
  name: model-inference
  namespace: ml-serving
spec:
  hosts:
    - inference.mycompany.com
  gateways:
    - inference-gateway
  http:
    # A/B test: route by header
    - match:
        - headers:
            x-model-version:
              exact: "v2"
      route:
        - destination:
            host: model-v2-svc
            port:
              number: 8080
    # Default: weighted canary split
    - route:
        - destination:
            host: model-v1-svc
            port:
              number: 8080
          weight: 90
        - destination:
            host: model-v2-svc
            port:
              number: 8080
          weight: 10
      timeout: 120s
      retries:
        attempts: 2
        perTryTimeout: 60s
        retryOn: connect-failure,refused-stream,unavailable
Common Implementation Mistakes
- ●
Using round-robin for LLM inference: Round-robin distributes requests evenly by count, but LLM requests have wildly different processing times. A 4,000-token generation holds a GPU 100x longer than a 10-token completion. Use least-connections or GPU-aware routing instead.
- ●
Setting proxy timeouts too low: Default Nginx proxy_read_timeout is 60 seconds. Long LLM generation tasks can easily exceed this, causing premature 504 Gateway Timeout errors. Set timeouts to at least 120-300 seconds for generative models.
- ●
Retrying on HTTP 5xx responses from model servers: A 500 from the model server often means the input was invalid (bad tokens, oversized input), not a transient failure. Retrying sends the same bad request to another replica, wasting GPU compute. Only retry on connection errors and timeouts.
- ●
Ignoring GPU memory pressure in health checks: A replica can be HTTP-healthy (returns 200 on /health) but GPU-memory-exhausted, causing OOM on the next large request. Augment health checks with GPU memory thresholds using NVIDIA DCGM metrics.
- ●
Not accounting for model warm-up time: When a new replica starts or scales up, the first few requests trigger model loading and CUDA context initialization, taking 10-60 seconds. Sending full traffic immediately causes timeouts. Use readiness probes with sufficient
initialDelaySeconds(30-120s depending on model size). - ●
Mixing model versions behind a single load balancer without version pinning: If v1 and v2 of a model produce different output formats, clients may receive inconsistent responses. Use traffic splitting with explicit version routing, not random mixing.
When Should You Use This?
Use When
You have 2 or more model replicas serving the same model and need to distribute traffic across them
Your inference workload has variable latency (e.g., LLM generation where input/output lengths vary significantly)
You need high availability -- if one replica goes down, traffic must seamlessly shift to healthy replicas without client impact
You are running A/B tests or canary deployments that require controlled traffic splitting between model versions
Your GPU fleet is heterogeneous (mixing A100, H100, T4 GPUs) and replicas have different processing capacities
You need graceful scaling -- adding or removing replicas without dropping in-flight requests
Your system must handle burst traffic (e.g., Diwali sale spikes on an Indian e-commerce platform, IPL match predictions on a sports platform)
Avoid When
You have a single model replica -- a load balancer adds latency and complexity with no benefit. Just use a direct service endpoint.
Your inference is batch-only (offline scoring, not real-time) -- use a job scheduler (Airflow, Kubernetes Jobs) instead of a load balancer
The model server already handles internal request queuing and batching well (e.g., Triton's dynamic batching) and you only have homogeneous replicas -- Kubernetes Service with kube-proxy may suffice
You are in early prototyping with <100 requests/day -- the operational overhead of configuring and monitoring a load balancer outweighs the benefits
Your requests require strict ordering (e.g., sequential processing of a conversation) -- load balancing across replicas would break ordering. Use session affinity or route the entire conversation to one replica.
Key Tradeoffs
Algorithm Complexity vs. Routing Quality
| Algorithm | Overhead | Statefulness | Best For | Worst For |
|---|---|---|---|---|
| Round-Robin | O(1) | Stateless | Uniform workloads | Variable latency |
| Weighted Round-Robin | O(1) | Stateless | Heterogeneous GPUs | Variable latency |
| Least Connections | O(N) per request | Per-connection state | Variable latency | Very high QPS (>100K) |
| Consistent Hashing | O(1) amortized | Hash ring state | Cache affinity (KV cache) | Non-uniform key distribution |
| GPU-Aware (composite) | O(N) + telemetry | Full backend state | LLM inference at scale | Simple models, low QPS |
Centralized vs. Distributed Load Balancing
A centralized load balancer (single Envoy/Nginx instance) is simpler to configure and debug but becomes a single point of failure and a throughput bottleneck at extreme scale. A distributed approach (Istio sidecar mesh, or multiple LB instances behind DNS round-robin) eliminates the SPOF but adds network hops and configuration complexity.
For most Indian startups and mid-scale deployments (up to ~50K QPS), a centralized HA pair (active-passive) is sufficient and costs ~INR 5,000-15,000/month on cloud. For hyperscale (>100K QPS), a distributed mesh becomes necessary.
Latency Added by the Load Balancer
A well-configured Envoy or Nginx proxy adds 0.1-0.5ms of latency per request for simple routing, or 1-3ms for telemetry-aware routing that involves metrics lookups. This is negligible compared to inference latency (typically 50ms-30s), but it matters at the tail: if you're already fighting P99 latency, an extra 3ms from the LB is 3ms you can't afford.
Practical Advice: Start with least-connections on Nginx or Envoy. Only upgrade to GPU-aware routing when you have evidence (metrics) that least-connections is causing hot spots or wasted cache. Premature optimization of load balancing is a real thing.
Alternatives & Comparisons
For single-replica deployments or very low traffic, exposing the model server directly via a Kubernetes Service or cloud endpoint is simpler and adds zero proxy latency. However, you lose health-based failover, traffic splitting, and the ability to scale beyond one replica transparently. Choose direct endpoints for prototypes and dev environments; use a load balancer for any production deployment with >1 replica.
Frameworks like Triton Inference Server and vLLM have built-in request queuing and dynamic batching, which partially overlap with load balancer functionality. However, they operate at the single-replica level -- they optimize how one GPU processes its queue, not how requests are distributed across GPUs. A load balancer is the inter-replica coordinator; the serving framework is the intra-replica optimizer. You typically need both.
Rate limiters control the volume of traffic; load balancers control the distribution. A rate limiter says 'only 100 requests per second allowed.' A load balancer says 'of these 100 requests, send 40 to Replica A, 35 to Replica B, and 25 to Replica C.' They are complementary: the rate limiter sits upstream of the load balancer and protects the entire system from overload, while the load balancer optimizes within the admitted traffic.
Canary deployment systems (Flagger, Argo Rollouts) automate progressive traffic shifts between model versions, monitoring metrics and rolling back on failure. The load balancer provides the traffic-splitting mechanism; the canary controller provides the automation and decision logic. Many teams use Flagger + Istio/Envoy: Flagger decides when to shift traffic, the Envoy load balancer executes how.
Pros, Cons & Tradeoffs
Advantages
High availability through failover: If a GPU replica crashes or becomes unresponsive, the load balancer automatically routes traffic to healthy replicas within seconds, preventing downtime. This is non-negotiable for production ML systems.
Optimal GPU utilization: By distributing requests based on current load, utilization, or queue depth, the load balancer prevents the scenario where some GPUs are at 95% while others idle at 10%. For a fleet of 10 A100s at 6/hour (~INR 500/hour, ~INR 3.6 lakh/year).
Seamless canary and A/B testing: Traffic splitting enables safe rollout of new model versions by directing a small percentage of traffic to the new version while monitoring for regressions -- essential for continuous ML deployment.
Transparent horizontal scaling: Adding or removing replicas requires no client-side changes. The load balancer discovers new backends via health checks or Kubernetes service discovery and starts routing to them automatically.
Protocol flexibility: Modern proxies like Envoy natively support HTTP/1.1, HTTP/2, gRPC, and WebSocket -- all protocols commonly used in ML inference. This eliminates the need for protocol-specific routing logic in application code.
Observability insertion point: The load balancer is a natural place to collect per-request metrics (latency, status codes, replica distribution), inject tracing headers, and log request/response metadata for debugging inference issues.
Disadvantages
Added latency: Every request passes through an additional network hop. While typically 0.1-3ms, this compounds at high QPS and can affect tail latency. For ultra-low-latency inference (<10ms), the load balancer overhead becomes a meaningful fraction.
Single point of failure risk: A centralized load balancer that goes down takes the entire inference service offline. Mitigation requires HA configurations (active-passive, multiple instances behind DNS), which add operational complexity.
Configuration complexity for ML workloads: Getting timeouts, health check intervals, circuit breaker thresholds, and retry policies right for ML inference (where latency variance is 100x wider than web traffic) requires careful tuning and domain knowledge.
State management overhead for advanced algorithms: GPU-aware and KV cache-aware routing require real-time telemetry from backends, adding a metrics pipeline dependency. If the telemetry is stale or missing, routing decisions degrade to simple round-robin.
Cold-start amplification: When a new replica joins the pool, the load balancer may flood it with requests before it has warmed up (loaded model weights, initialized CUDA context), causing a burst of timeouts. Slow-start and readiness probes mitigate this but require configuration.
Cost at scale: While open-source proxies are free, running them in HA with monitoring at scale requires dedicated infrastructure. On AWS, a pair of NLBs costs ~0.006 per GB (~INR 0.50/GB).
Failure Modes & Debugging
Hot-spot overload on a single replica
Cause
Round-robin or random routing used with highly variable request latency. One replica gets several long-running requests (e.g., long LLM generations) while others finish quickly and sit idle. The overloaded replica queues up, latency spikes, and eventually OOMs or times out.
Symptoms
One replica shows 90%+ GPU utilization while others show 30-40%. P99 latency is 10-50x higher than P50. Client-side timeout errors spike intermittently. Prometheus metrics show skewed active_requests distribution across replicas.
Mitigation
Switch from round-robin to least-connections or least-response-time routing. For LLM workloads, use GPU utilization-aware routing that considers gpu_utilization and pending_requests from each replica. Implement request cost estimation where the router estimates compute cost based on input token count and routes proportionally.
Cascade failure from aggressive retries
Cause
Load balancer configured to retry failed requests on alternate replicas (e.g., proxy_next_upstream error timeout http_502 http_503). When one replica is slow under load, retries amplify the total request volume, pushing remaining replicas past capacity. This creates a positive feedback loop that takes down the entire fleet.
Symptoms
All replicas simultaneously spike to 100% utilization. Request count at the LB is 2-5x the client-side request count (due to retries). Error rate jumps from 1% to 90%+ within seconds. Classic retry storm / thundering herd pattern.
Mitigation
Limit retries: set proxy_next_upstream_tries 2 (Nginx) or max_retries: 1 (Envoy circuit breaker). Only retry on connection errors, not on HTTP 5xx (which may indicate input errors). Implement exponential backoff on the client side. Add circuit breakers that open when error rate exceeds a threshold (e.g., 50% in 10s window), temporarily stopping all requests to the failing replica.
Stale health check masking GPU exhaustion
Cause
Health check endpoint returns HTTP 200 based on process health, but the GPU is out of memory or CUDA context is corrupted. The load balancer considers the replica healthy and continues routing traffic to it, resulting in CUDA OOM errors on every inference request.
Symptoms
Health checks pass (HTTP 200) but inference requests consistently fail with CUDA out-of-memory errors or model loading errors. Error logs show RuntimeError: CUDA out of memory or CUDA error: device-side assert triggered.
Mitigation
Implement deep health checks that verify GPU memory availability, not just process health. Triton's /v2/health/ready checks model readiness, not GPU memory. Add a custom health endpoint that queries nvidia-smi or DCGM to verify free GPU memory exceeds a threshold (e.g., 2GB). Alternatively, use passive health checking: if a replica returns 3 consecutive inference errors, mark it unhealthy regardless of health endpoint status.
KV cache thrashing from random routing
Cause
For LLM inference with prefix caching, requests from the same conversation or with the same system prompt are routed to different replicas, preventing KV cache reuse. Each replica recomputes the prefix from scratch, wasting 30-70% of compute.
Symptoms
Time-to-first-token (TTFT) is consistently high even for follow-up messages in the same conversation. GPU utilization is high but throughput is lower than expected. Cache hit ratio metrics (if available from vLLM or TensorRT-LLM) show <10% hit rates.
Mitigation
Implement consistent hashing based on conversation ID, session ID, or system prompt hash. Use Consistent Hashing with Bounded Loads (CHWBL) to maintain cache affinity while preventing hot spots. The vLLM Router and KubeAI's PrefixHash strategy implement this pattern. Fallback: use sticky sessions via cookies or headers to route the same user to the same replica.
Cold-start thundering herd on new replicas
Cause
A new replica joins the pool (via auto-scaling or replacement). The load balancer immediately routes full traffic share to it. The replica hasn't finished loading model weights into GPU memory (10-120 seconds for large models). All routed requests queue up and time out.
Symptoms
Burst of 504 Gateway Timeout errors immediately after a scale-up event. The new pod's readiness probe eventually passes, but the initial wave of requests has already failed. Logs show model loading messages concurrent with request handling attempts.
Mitigation
Configure readiness probes with sufficient initialDelaySeconds (30-120s depending on model size). Use slow-start in the load balancer: Envoy supports slow_start_window where a new backend ramps from 0 to full weight over a configurable period (e.g., 60 seconds). In Nginx Plus, configure slow_start=30s. Alternatively, have the model server delay health check readiness until the model is fully loaded and a warmup inference has completed.
Split-brain during network partition
Cause
Network partition between the load balancer and a subset of replicas. The LB marks partitioned replicas as unhealthy and routes all traffic to remaining replicas, which may be insufficient to handle the full load. Meanwhile, the partitioned replicas are actually healthy and processing requests from any cached connections.
Symptoms
Sudden drop in perceived healthy replicas. Remaining replicas spike to 100% utilization. Possible duplicate processing if clients retry on both the LB path and direct replica paths. After partition heals, a burst of delayed responses arrives.
Mitigation
Run multiple load balancer instances in different availability zones. Use longer unhealthy thresholds (e.g., 5 consecutive failures over 50 seconds) to tolerate brief network blips. Implement graceful degradation: when healthy replicas drop below a threshold, activate request shedding (return 503 with Retry-After header) rather than overloading remaining replicas.
Placement in an ML System
Where Does the Load Balancer Sit in an ML System?
In a typical ML inference pipeline, the load balancer sits at the serving layer, between the external-facing API gateway (or rate limiter) and the model serving instances:
Client -> API Gateway -> Rate Limiter -> Load Balancer -> Model Server (GPU) -> Response
The API gateway handles authentication, request validation, and API versioning. The rate limiter caps request volume. The load balancer distributes admitted requests across healthy model replicas. The model server executes inference on the GPU.
For multi-model deployments (e.g., an ensemble of embedding model + re-ranker + LLM), each model stage may have its own load balancer and replica pool. The orchestration layer (e.g., KServe InferenceGraph, Seldon Pipeline) coordinates the multi-hop request flow, with load balancing at each hop.
In Kubernetes-native deployments, the load balancer is often implemented as an Ingress controller (Nginx Ingress, Envoy Gateway) or through the Kubernetes Gateway API with the Inference Extension for ML-specific routing. On managed cloud platforms, services like AWS Application Load Balancer, Google Cloud Load Balancing, or Azure Application Gateway provide managed alternatives.
Key Insight: The load balancer is the last line of defense between uneven traffic and expensive GPU resources. Every other component in the pipeline (API gateway, rate limiter, auto-scaler) works with the load balancer, not instead of it.
Pipeline Stage
Serving / Deployment
Upstream
- api-endpoint
- rate-limiter
Downstream
- model-serving
- canary-deploy
Scaling Bottlenecks
The load balancer itself is rarely the bottleneck -- Envoy can handle 100K+ RPS on a single core, and Nginx can do similar. The bottleneck is almost always the backend GPU replicas.
However, at extreme scale (>500K RPS), the load balancer's connection tracking and telemetry aggregation become the constraint. Each active connection consumes ~10KB of memory in Envoy. With 100K concurrent connections and GPU metrics scraping every 5 seconds, memory usage can reach 1-2GB per LB instance.
The second bottleneck is health check overhead. With 1,000 backend replicas checked every 10 seconds, the LB generates 100 health check requests per second -- manageable, but the responses must be processed and acted upon quickly. Stale health check data leads to routing decisions based on outdated state.
For GPU-aware routing specifically, the telemetry pipeline introduces a staleness window: if GPU utilization metrics are scraped every 5 seconds, routing decisions are always based on data that is 0-5 seconds old. During traffic bursts, this staleness can cause several requests to pile up on a replica that was lightly loaded 3 seconds ago but is now saturated.
Production Case Studies
Google developed the GKE Inference Gateway to overcome limitations of traditional load balancing for LLM serving on Google Kubernetes Engine. The gateway implements model-aware routing that considers KV cache utilization, pending request queue depth, and GPU utilization -- metrics that standard HTTP load balancers ignore. It extends the Kubernetes Gateway API with inference-specific custom resources.
GKE Inference Gateway reduced tail latency (P99) by up to 3x and improved GPU utilization by 40% compared to standard Kubernetes Service load balancing, while maintaining the same hardware fleet. The system now powers Vertex AI's serving infrastructure.
Uber's Michelangelo ML platform distributes GPU inference workloads across multiple Kubernetes clusters in different availability zones and regions. Their federation layer handles cross-cluster load balancing for batch and real-time inference, addressing the challenge of heterogeneous GPU allocation across clusters. The system routes inference requests to the cluster with the best available GPU resources, not just the nearest one.
Unified GPU federation improved overall cluster utilization from ~60% to ~85%, reducing wasted GPU capacity by an estimated $2M+ annually across their global fleet. Cross-region failover ensures inference availability even during single-region outages.
Swiggy's Data Science Platform (DSP) serves hundreds of real-time and batch ML models generating over 1 billion predictions per day. The platform uses load-balanced model serving with a feature store that retrieves features at inference time. Their serving infrastructure handles extreme traffic spikes during meal hours (12-2 PM and 7-10 PM IST) and special events like IPL matches, requiring dynamic load balancing across model replicas.
DSP handles 1B+ daily predictions with sub-50ms P95 latency for real-time models. The load-balanced architecture ensures consistent performance during 3-5x traffic spikes during peak meal times, serving 50+ million monthly active users across 500+ Indian cities.
Razorpay's Thirdwatch fraud detection product uses Apache Flink for real-time ML model serving to evaluate every transaction in real time. The Mitra Data Platform handles feature generation and model inference at scale, with load-balanced serving across multiple model instances to ensure that fraud scores are returned within the tight latency budgets required for payment authorization (~100ms end-to-end).
Real-time fraud detection with <100ms inference latency, processing millions of transactions daily across Razorpay's payment network, which handles INR 10+ lakh crore in annual payment volume. The load-balanced architecture ensures zero-downtime model updates for evolving fraud patterns.
Anyscale documented production patterns for load-balanced ML model serving using Ray Serve. Their system implements adaptive batching at the replica level combined with an intelligent request router that considers replica queue depth, GPU utilization, and model-specific throughput characteristics. The router supports multi-model composition where a single request fans out to multiple models, each with its own load-balanced replica pool.
Ray Serve's built-in load balancer achieves near-linear throughput scaling across replicas (0.9x linear scaling efficiency up to 32 replicas), with continuous batching improving per-replica throughput by 10-23x over naive single-request processing for LLM workloads.
Tooling & Ecosystem
The most widely deployed reverse proxy and load balancer. Supports round-robin, least-connections, IP hash, and weighted routing. Passive health checks in open-source; active health checks in Nginx Plus. Excellent raw throughput (~42K RPS on 4-core) with minimal resource usage (~80MB RAM). Best for straightforward ML inference routing without ML-specific telemetry needs.
Modern, high-performance L4/L7 proxy designed for microservices. Native gRPC support (critical for Triton, TensorFlow Serving), active health checks, circuit breakers, and extensive observability. Forms the data plane for Istio service mesh. The recommended choice for ML inference due to its extensibility via WASM filters for custom routing logic (e.g., GPU-aware routing).
Ultra-high-performance TCP/HTTP load balancer with the lowest latency and highest throughput among open-source options (~50K RPS, sub-ms P99 latency). Supports advanced health checking, connection draining, and rate limiting. Lacks native gRPC support (requires HTTP/2 pass-through), which limits its use with gRPC-based model servers.
Official Kubernetes SIG extension that adds inference-aware load balancing to standard Gateway API implementations (Envoy Gateway, GKE Gateway). Supports model-server-aware routing based on metrics like KV cache utilization, pending requests, and GPU memory. The emerging standard for ML inference routing on Kubernetes.
Purpose-built load balancer for vLLM inference clusters. Implements prefix-aware routing via consistent hashing for KV cache reuse, session affinity for multi-turn conversations, and prefill/decode disaggregation-aware routing. Designed specifically for the unique requirements of LLM serving.
Service mesh built on Envoy that provides traffic management, security, and observability for Kubernetes workloads. Supports weighted traffic splitting for canary deployments, header-based routing for A/B tests, circuit breaking, and fault injection for chaos testing. Adds ~2-5ms latency per hop due to sidecar proxy overhead.
Cloud-native reverse proxy with automatic service discovery and Let's Encrypt integration. Supports weighted round-robin, sticky sessions, health checks, and canary deployments via traffic mirroring. Lower raw performance than Nginx/HAProxy (~19K RPS) but simpler configuration for Kubernetes-native deployments.
NVIDIA's inference orchestration framework with built-in KV cache-aware routing. Implements a disaggregated prefill-decode architecture where the router directs prefill and decode phases to specialized GPU pools, with KV cache transfer between them. Optimized for NVIDIA GPU clusters running TensorRT-LLM.
Research & References
Crankshaw, Wang, Zhou, Franklin, Gonzalez, Stoica (2017)USENIX NSDI 2017
Introduced the foundational architecture for ML prediction serving with adaptive batching and model selection across replicas. Clipper's load balancer uses bandit methods to route requests across model variants, establishing the template for modern ML inference routing.
Kwon, Li, Zhuang, Sheng, Zheng, Yu, Gonzalez, Zhang, Stoica (2023)ACM SOSP 2023
Presented vLLM and the PagedAttention mechanism for efficient KV cache management in LLM serving. The paper demonstrates how memory management directly impacts load balancing: better KV cache packing allows more concurrent requests per GPU, changing the capacity parameters that load balancers must account for.
Miao, Oliaro, Zhang, Cheng, Jin, Hao, Wang, Zheng, Jia, Zhang (2024)arXiv preprint
Comprehensive survey of LLM inference serving covering cluster-level load balancing, scheduling, memory management, and parallelism strategies. Classifies load balancing approaches into heuristic, dynamic, and predictive categories with analysis of trade-offs.
Yu, Jeong, Kim, Kim, Chun (2022)USENIX OSDI 2022
Introduced iteration-level scheduling (continuous batching) for transformer inference, which fundamentally changed how load balancers interact with model servers. By decoupling batching from request arrival, Orca enables load balancers to route requests to partially-full batches, improving GPU utilization by 36x over static batching.
Zhang, Li, Chen et al. (2025)arXiv preprint
Proposes a geo-distributed load balancer for LLM inference that optimizes across data locality (KV cache affinity), network latency (cross-region hops), and load balance. Uses consistent hashing with session-based routing and a multi-region prefix trie for cache-aware cross-region routing.
Li, Zhang, Zheng, Chen et al. (2025)arXiv preprint
Surveys the full stack of LLM inference serving including request scheduling, memory management, parallelism, and load balancing. Analyzes how KV cache management strategies (paged attention, prefix sharing, disaggregated prefill-decode) interact with load balancing decisions.
Interview & Evaluation Perspective
Common Interview Questions
- ●
How would you design a load balancer for an LLM inference service handling 10,000 requests per second across 50 GPU replicas?
- ●
Why is round-robin insufficient for ML inference load balancing? What algorithm would you use instead?
- ●
How would you implement canary deployments for a new model version without impacting production traffic?
- ●
Explain the difference between L4 and L7 load balancing. Which is better for ML inference and why?
- ●
How would you handle a scenario where one model replica is healthy but returning incorrect predictions?
- ●
Design a load balancing strategy for a heterogeneous GPU fleet with A100, H100, and T4 GPUs serving the same model.
- ●
How does KV cache affinity affect load balancing decisions in LLM serving?
Key Points to Mention
- ●
ML inference load balancing differs from web load balancing because of high latency variance (10ms to 30s), expensive resources (GPUs at $2-4/hour), and stateful resources (KV caches, batch queues) that create affinity requirements.
- ●
Least-connections is the minimum viable algorithm for variable-latency ML workloads. Round-robin creates hot spots when request processing times vary by more than 2x.
- ●
Health checks must go beyond HTTP 200 -- they need to verify GPU health (memory available, CUDA context intact) and model readiness (weights loaded, warmup complete). A shallow health check is worse than no health check because it creates false confidence.
- ●
For LLM inference specifically, KV cache-aware routing via consistent hashing can improve throughput by 30-70% by enabling prefix cache reuse, but it must be bounded to prevent load imbalance.
- ●
Traffic splitting for canary deployments is a load balancer feature, but the automation (when to promote, when to rollback) should be handled by a separate controller (Flagger, Argo Rollouts). Don't conflate the mechanism with the policy.
- ●
Always mention the stability condition: . No load balancing algorithm can save a system where demand exceeds capacity. Load balancing optimizes distribution, not capacity.
Pitfalls to Avoid
- ●
Treating load balancing as a solved problem for ML -- standard web patterns (round-robin, random) fail catastrophically for variable-latency GPU workloads.
- ●
Ignoring the cold-start problem: new replicas need warm-up time before receiving full traffic. Failing to mention slow-start or readiness probes shows a lack of production experience.
- ●
Conflating load balancing with auto-scaling -- they solve different problems (distribution vs. capacity) and both are needed.
- ●
Suggesting overly complex solutions for simple problems -- if you have 3 replicas serving a BERT model with uniform 10ms latency, you don't need GPU-aware routing. Least-connections is fine.
- ●
Forgetting to discuss failure handling: what happens when a replica goes down, when the load balancer itself fails, when there's a network partition. Interviewers want to see resilience thinking.
Senior-Level Expectation
A senior or staff-level candidate should discuss the full lifecycle: algorithm selection with quantitative justification (not just 'I'd use least connections' but why given the workload characteristics), health check design that covers both shallow and deep checks, telemetry pipeline for GPU-aware routing (Prometheus + DCGM exporter + scrape interval tradeoffs), traffic splitting strategy for safe model rollouts, capacity planning (how many replicas for a given QPS at target P99 latency), and cost optimization (choosing the right GPU type per model, spot instances with graceful draining). They should be able to reason about the interaction between load balancing and other system components: how auto-scaling triggers affect LB behavior, how rate limiting interacts with LB decisions, how circuit breakers prevent cascade failures. For Indian context, discussing cost-efficient architectures (e.g., using T4 spot instances at ~INR 25/hour for non-latency-critical inference with weighted routing to A100 on-demand for latency-sensitive traffic) demonstrates practical judgment.
Summary
Recap
A load balancer in ML systems distributes inference requests across GPU model replicas to maximize throughput, minimize tail latency, and ensure high availability. Unlike traditional web load balancing, ML inference introduces unique challenges: wildly variable request latency (10ms to 30s for LLMs), expensive and finite GPU resources ($2-4/hour per GPU), and stateful resources like KV caches that benefit from request affinity.
The choice of algorithm matters significantly. Round-robin works for uniform-latency models but fails for LLMs. Least-connections is the minimum viable algorithm for variable-latency workloads. KV cache-aware routing via consistent hashing with bounded loads provides the best throughput for LLM serving by maximizing prefix cache reuse. GPU utilization-aware routing adds another layer of intelligence by considering real-time backend telemetry.
In production, the load balancer integrates with health checks (HTTP + GPU-level), circuit breakers (to prevent cascade failures), and traffic splitters (for canary deployments and A/B tests). Tools like Envoy Proxy (with its extensible filter chain), the Kubernetes Gateway API Inference Extension, and vLLM Router represent the current state of the art for ML-specific inference routing. For Indian teams, starting with Nginx or Envoy on a managed Kubernetes cluster and upgrading to ML-aware routing as scale demands is the most cost-effective path.
The load balancer is the bridge between uneven traffic patterns and expensive GPU resources. It doesn't make individual inferences faster, but it ensures that every GPU-dollar in your fleet is working productively. At 25,000/year (~INR 21 lakh/year) in savings -- more than enough to justify the engineering investment.