Canary Deploy in Machine Learning
A canary deployment is a progressive delivery strategy that rolls out a new ML model version to a small fraction of production traffic, monitors key metrics against the incumbent model, and gradually shifts more traffic only when statistical evidence confirms the new version is safe. The name comes from the "canary in the coal mine" -- miners brought canaries underground because the birds would show signs of toxic gas before humans did. Your canary model serves the same purpose: it encounters production data first, at low blast radius, so you can detect problems before they affect your entire user base.
In ML systems, canary deployments are more nuanced than in traditional software. A buggy microservice throws errors you can count. A degraded ML model might return predictions that are technically valid HTTP 200 responses but semantically wrong -- lower click-through rates, worse fraud detection, biased recommendations. Detecting these "silent regressions" requires comparing distributional metrics between canary and stable versions with statistical rigor, not just checking error rates.
Canary deployment has become the de facto standard for production ML model updates at companies like Google, Netflix, Uber, and DoorDash. Uber's Michelangelo platform processes thousands of model updates weekly using canary gates, and Netflix's Kayenta system automates statistical canary analysis across their entire infrastructure. Whether you are rolling out a retrained recommendation model at Flipkart or updating a fraud detection model at Razorpay, canary deployment is the mechanism that lets you move fast without breaking things.
This guide covers everything you need to implement canary deployments for ML models: traffic splitting strategies, rollback trigger design, statistical significance testing, tooling choices, and the failure modes that catch even experienced teams off guard.
Concept Snapshot
- What It Is
- A deployment strategy that gradually routes an increasing percentage of production traffic to a new ML model version while continuously comparing its performance metrics against the stable version, promoting or rolling back based on statistical analysis.
- Category
- Deployment
- Complexity
- Intermediate
- Inputs / Outputs
- Inputs: new model artifact, traffic routing rules, metric thresholds, analysis configuration. Outputs: fully promoted model (success) or automatic rollback to stable version (failure).
- System Placement
- Sits between the model registry (upstream) and the production serving infrastructure (downstream), orchestrating how traffic is split between model versions at the load balancer or service mesh layer.
- Also Known As
- canary release, canary rollout, progressive delivery, incremental rollout, phased deployment, graduated traffic shifting
- Typical Users
- ML Engineers, MLOps Engineers, Platform Engineers, SRE Teams, Data Scientists deploying models
- Prerequisites
- Model serving infrastructure (e.g., KServe, Seldon Core, or custom serving), Service mesh or load balancer with traffic splitting (e.g., Istio, Envoy), Monitoring and metrics collection (Prometheus, Datadog), Model registry for versioned artifacts, Basic understanding of statistical hypothesis testing
- Key Terms
- traffic splittingcanary weightrollback triggercanary analysisblast radiusprogressive deliverystatistical significancemetric gatepromotion criteriabake time
Why This Concept Exists
The Problem: ML Models Fail Silently
Here is the uncomfortable truth about ML model deployments: most failures don't produce errors. A retrained recommendation model that has silently drifted toward popular items still returns valid JSON responses with 200 status codes. A fraud detection model with degraded recall still classifies most transactions correctly. The damage is real -- lost revenue, undetected fraud, degraded user experience -- but it hides behind green dashboards.
Traditional software deployment strategies like "deploy and pray" or even basic blue-green switching don't catch these silent regressions because they rely on error rates and latency as primary health signals. ML models need semantic health checks: is the prediction quality actually maintained?
Why Not Just Use A/B Testing?
A/B testing and canary deployment solve different problems, though they look similar on the surface. A/B testing answers the question: "Is model B better than model A?" It requires statistical power, often needs days or weeks of data, and optimizes for discovering improvements. Canary deployment answers a different question: "Is model B safe to deploy?" It focuses on detecting regressions quickly -- hours, not weeks -- and optimizes for minimizing blast radius.
You can think of canary as the safety gate that comes before a full A/B experiment. The canary confirms the new model doesn't break anything. The A/B test, run after promotion, confirms it actually improves things.
The Evolution from Manual to Automated
Early canary deployments were manual affairs. An engineer would deploy the new model to a single server, SSH in, watch logs for an hour, and then either proceed or roll back. This approach had obvious scaling problems: it depended on human attention, couldn't cover all metrics simultaneously, and was too slow for organizations deploying multiple model updates per day.
The modern approach -- pioneered by Netflix with their internal canary system (later open-sourced as Kayenta in 2018, jointly with Google) -- automates the entire cycle. Metrics are collected automatically, statistical tests run continuously, and promotion or rollback decisions happen without human intervention unless the result is ambiguous.
Historical Note: The term "canary release" was popularized by Jez Humble and David Farley in their 2010 book Continuous Delivery. Netflix adapted the concept for their microservices architecture, and it quickly became standard practice. The ML-specific adaptations -- comparing prediction distributions, monitoring feature drift alongside model metrics -- emerged around 2018-2020 as MLOps matured as a discipline.
Core Intuition & Mental Model
The Mental Model: A Controlled Experiment on Live Traffic
Think of a canary deployment as a real-time, automated clinical trial for your model. In a clinical trial, you don't give an untested drug to every patient simultaneously. You start with a small cohort, monitor for adverse effects, and only expand to the general population when safety data looks good. A canary deployment does exactly the same thing -- just with prediction requests instead of patients.
The key insight is that production traffic is the ultimate test set. No amount of offline evaluation on held-out data can fully predict how a model will behave when faced with the full diversity, adversarial conditions, and distributional shifts of real-world input. Canary deployment bridges the gap between offline evaluation ("the model looks good on our test set") and production reality ("the model works correctly at scale under real conditions").
Why Gradual Is Better Than Binary
Imagine you are the ML lead at a food delivery company like Swiggy. Your team has retrained the restaurant ranking model with new features. Offline metrics show a 3% improvement in NDCG@10. Do you deploy it to 100% of traffic immediately?
If you do, and the model has a subtle bug that causes it to under-rank restaurants in certain cities, you have just degraded the experience for millions of users. Revenue impact could be lakhs of rupees per hour. Worse, it might take hours to detect because your dashboards are showing aggregate metrics that look fine -- the degradation is concentrated in specific segments.
With a canary deployment, you start at 1% of traffic. If the bug exists, it affects a tiny fraction of users. Your canary analysis compares the canary's metrics against the stable model's metrics on the remaining 99%. The per-city segmentation in your analysis catches the regression early. You roll back automatically, and the blast radius was limited to 1% of traffic for a few minutes.
The Golden Rule of Canary Deployments: The cost of a slow rollout is time. The cost of a fast rollout gone wrong is trust. Always err on the side of slower.
Technical Foundations
Formalizing the Canary Decision
Let denote the stable (incumbent) model and denote the canary (challenger) model. At any point during the rollout, a fraction of traffic is routed to and to .
The canary analysis evaluates a set of metrics collected from both populations. For each metric , we define:
- : the sample mean of metric observed on canary traffic
- : the sample mean of metric observed on stable traffic
The Hypothesis Test
For each metric, the canary analysis performs a non-inferiority test. The null hypothesis is that the canary is worse than the stable version by at least a margin :
Rejecting at significance level (typically 0.05) provides evidence that the canary is not degrading the metric beyond the tolerable margin.
Aggregate Canary Score
Kayenta and similar systems compute an aggregate canary score by combining individual metric judgments. A common approach weights each metric by criticality:
where is the weight assigned to metric and is 1 if the metric passed its non-inferiority test.
The deployment decision follows a threshold rule:
Typical thresholds are and .
Traffic Ramp Schedule
The traffic weight follows a step function over time:
where is the predefined ramp schedule. A typical schedule might be with bake times of 10, 15, 30, 30, 60 minutes between steps.
Sample Size Considerations
To detect a regression of effect size with power at significance level , the minimum sample size per group for a two-sample z-test is:
At 1% canary traffic with 10,000 requests per minute, you accumulate canary samples per hour -- sufficient to detect moderate effect sizes () with 80% power. For services with lower QPS (common in Indian startups), you may need longer bake times or higher initial canary weights.
Internal Architecture
A canary deployment system for ML models consists of several interacting components: a deployment controller that manages rollout state, a traffic router (service mesh or load balancer) that splits requests between versions, a metrics pipeline that collects and aggregates performance data, and a canary analyzer that runs statistical comparisons and issues promotion or rollback decisions.
The architecture must support two critical invariants: (1) at any point, the system can instantly route 100% of traffic back to the stable model (rollback), and (2) the canary and stable models receive traffic from the same population distribution to ensure fair comparison.
The deployment controller orchestrates the entire lifecycle. When a new model version appears in the model registry, it triggers a rollout: creating the canary deployment, configuring initial traffic weight, scheduling analysis intervals, and either promoting (shifting all traffic to canary) or rolling back (deleting canary, restoring stable to 100%) based on the analyzer's verdict.
Key Components
Deployment Controller
Manages the rollout state machine: initiates canary creation, schedules traffic weight increments, interprets analysis results, and executes promotion or rollback. In Kubernetes environments, this is typically Argo Rollouts or Flagger. For cloud-managed ML, services like SageMaker deployment guardrails or Vertex AI traffic splitting handle this natively.
Traffic Router / Service Mesh
Splits incoming inference requests between the stable and canary model deployments based on configurable weights. Istio VirtualService resources are the most common mechanism, using weighted routing rules on Envoy proxies. Alternatives include NGINX Ingress annotations, AWS ALB weighted target groups, and KServe's built-in canaryTrafficPercent field.
Stable Model Server
The currently promoted, fully trusted model version serving the majority of traffic. Runs as a Kubernetes Deployment (or equivalent) with its own ReplicaSet, autoscaler, and resource limits. During canary analysis, it serves as the control group for metric comparison.
Canary Model Server
The new model version under evaluation, initially receiving a small percentage of traffic. Deployed with identical infrastructure configuration (CPU, memory, replicas) to the stable server to ensure performance differences are attributable to the model, not the infrastructure.
Metrics Pipeline
Collects, aggregates, and stores metrics from both stable and canary servers. Captures three categories of metrics: infrastructure metrics (latency P50/P95/P99, error rate, throughput), model quality metrics (prediction distribution, confidence scores, feature drift), and business metrics (click-through rate, conversion, revenue per request). Typically built on Prometheus with custom recording rules, or Datadog with tagged metrics.
Canary Analyzer
The statistical engine that compares canary metrics against stable metrics and produces a pass/fail/marginal verdict. Implements non-inferiority hypothesis tests (Mann-Whitney U, Welch's t-test, or bootstrap confidence intervals) across all configured metrics. Kayenta (Netflix/Google) and Flagger's built-in analysis are the most widely used implementations.
Model Registry
Stores versioned model artifacts and metadata. Triggers the canary rollout pipeline when a new model version is registered with a production-ready tag. MLflow Model Registry, Vertex AI Model Registry, and SageMaker Model Registry are common choices.
Alerting & Notification System
Sends alerts when canary analysis yields marginal scores requiring human intervention, when automatic rollbacks are triggered, or when promotions succeed. Integrates with Slack, PagerDuty, or Microsoft Teams to keep the ML team informed.
Data Flow
Here is how data flows through the system during a canary rollout:
Trigger: A new model version is pushed to the model registry with a production-candidate tag. The deployment controller detects this event (via webhook or polling) and initiates the canary rollout.
Phase 1 — Canary Creation: The controller deploys the new model as a canary alongside the existing stable deployment. It configures the service mesh to route an initial fraction (e.g., 1%) of traffic to the canary.
Phase 2 — Bake & Analyze: During each bake period, the metrics pipeline collects inference metrics from both versions, tagged by version=stable and version=canary. At the end of each bake period, the canary analyzer fetches metrics from Prometheus/Datadog, runs statistical comparisons, and returns a score.
Phase 3 — Step or Stop: If the score passes the success threshold, the controller increments the canary traffic weight to the next step (e.g., 1% -> 5% -> 10% -> 25% -> 50% -> 100%). If the score falls below the failure threshold, the controller triggers an instant rollback: canary traffic weight goes to 0%, and the canary deployment is deleted. If the score is marginal, the controller can either hold and re-analyze or escalate to a human reviewer.
Phase 4 — Promotion: When the canary reaches 100% traffic and passes a final bake period, the controller promotes the canary to become the new stable version and cleans up the old stable deployment.
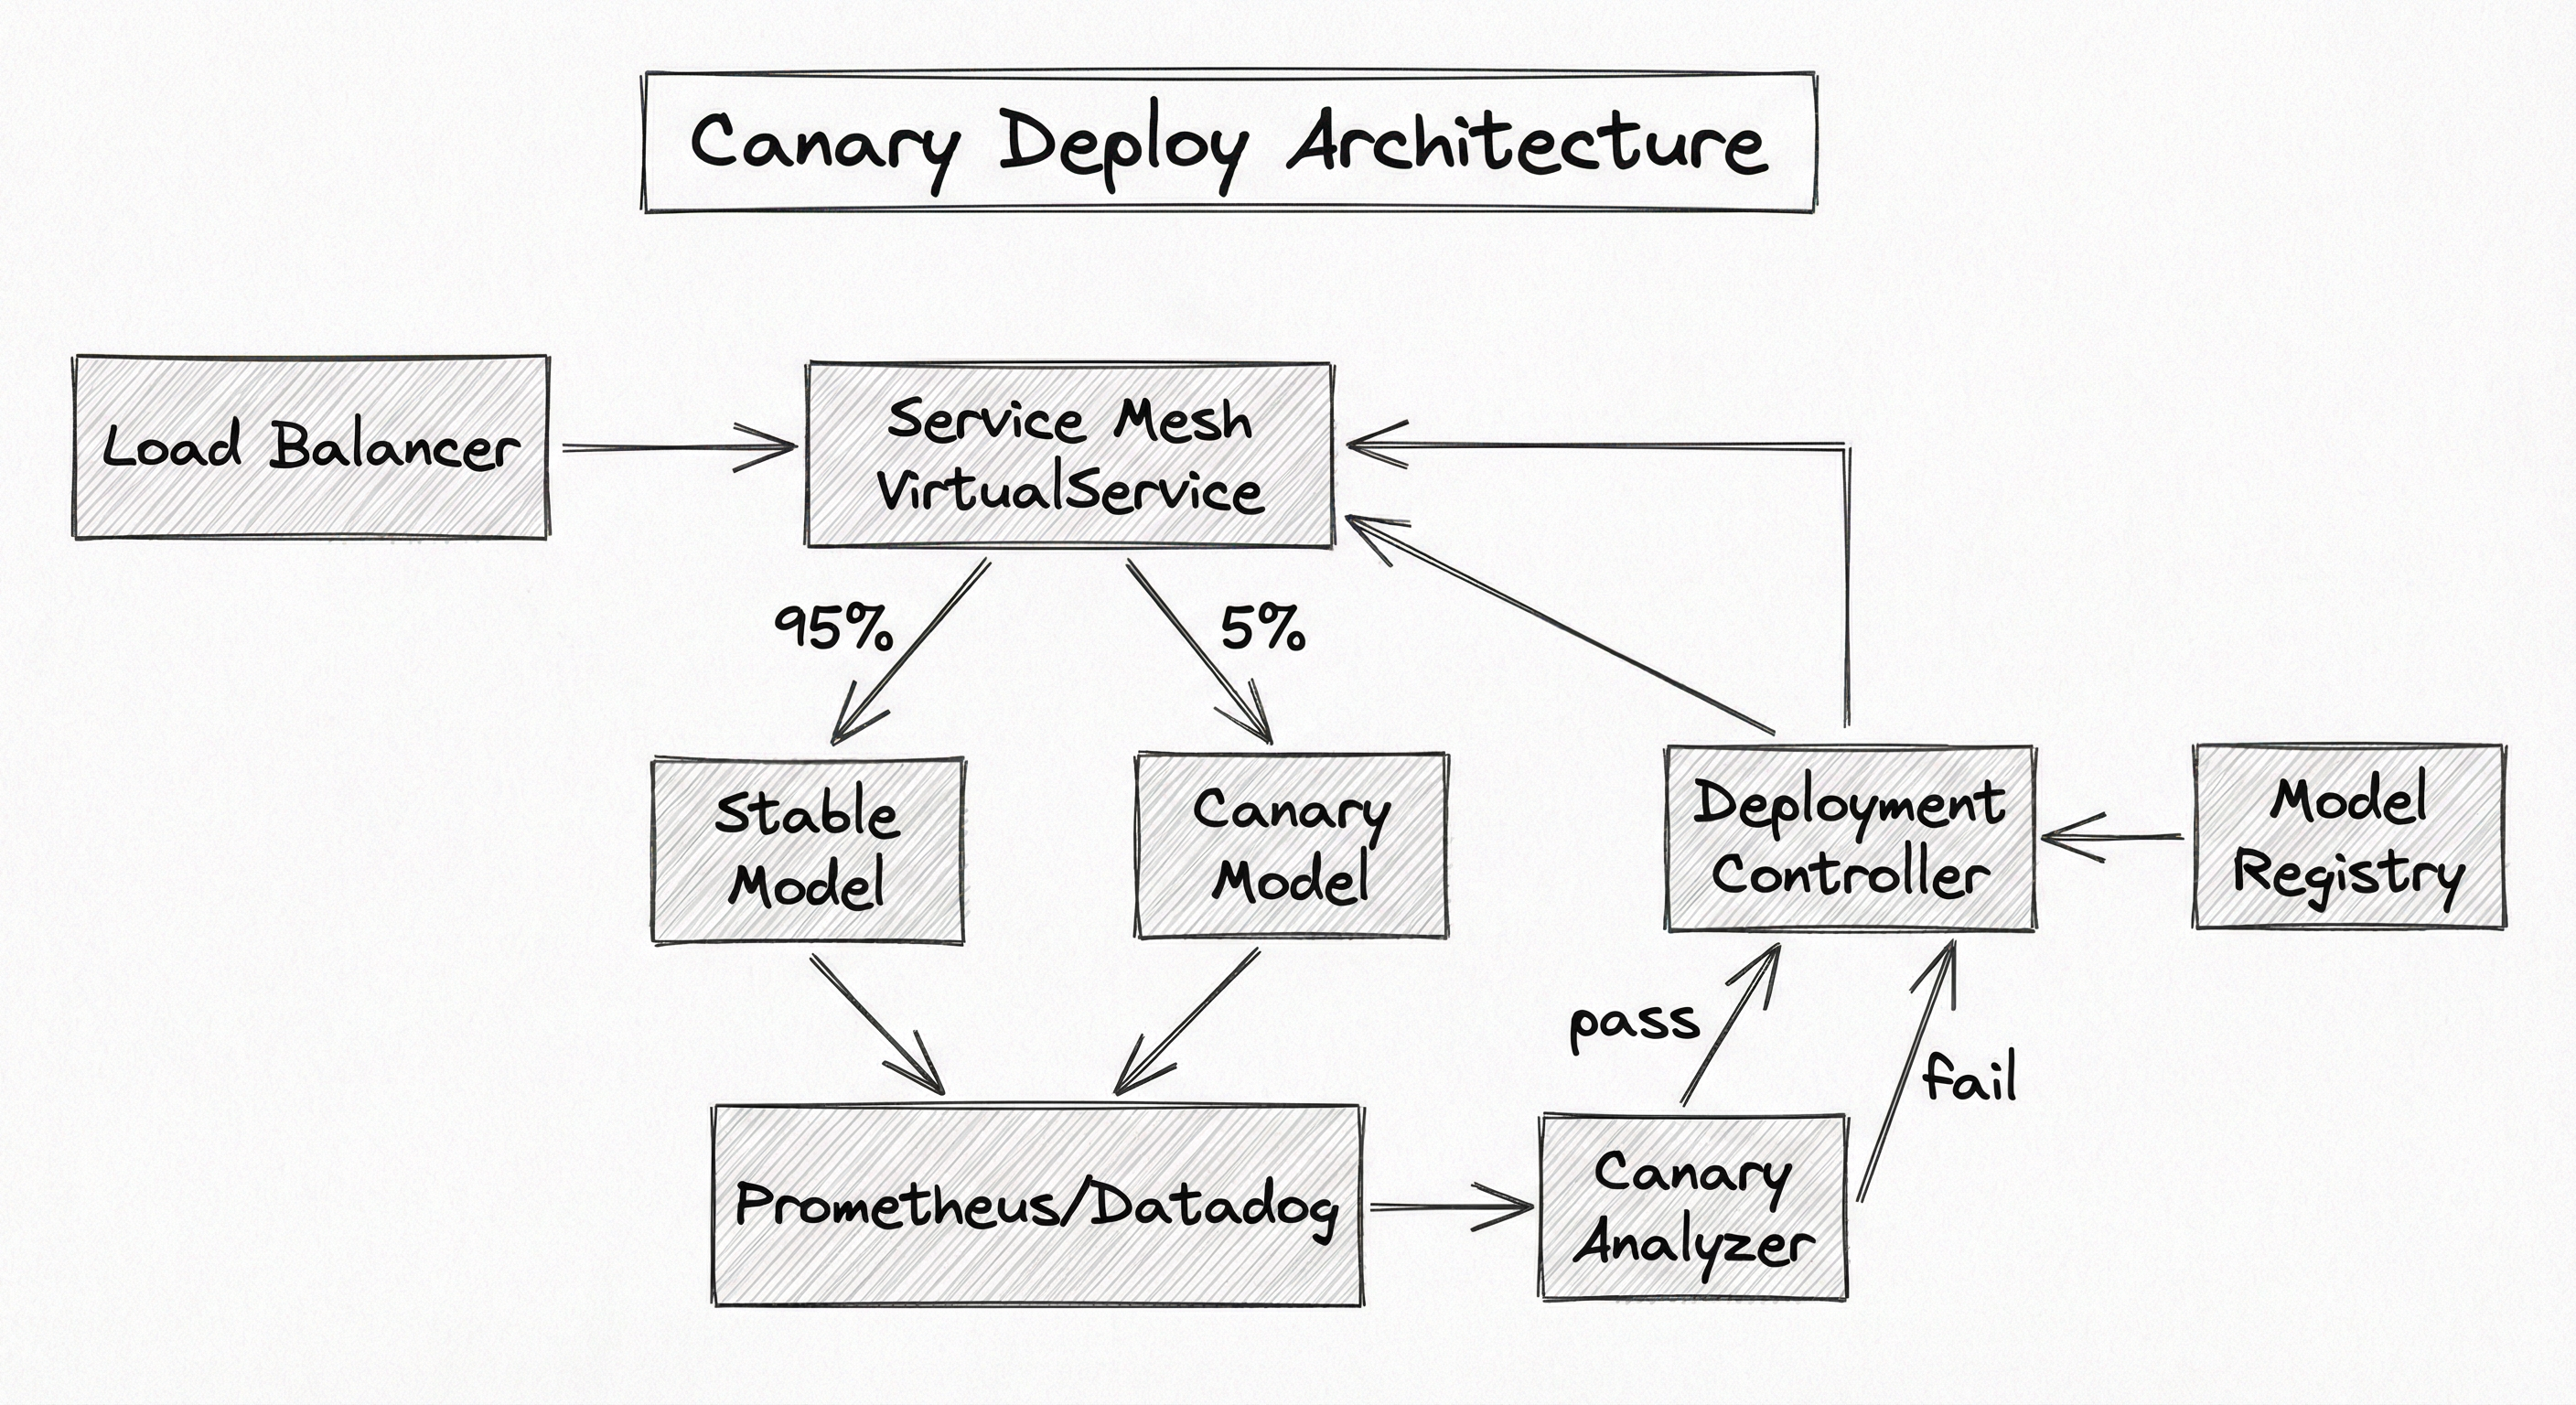
A flow diagram showing: Load Balancer routes to Service Mesh (Istio VirtualService), which splits traffic between Stable Model (95%) and Canary Model (5%). Both models feed metrics to Prometheus/Datadog, which feeds the Canary Analyzer (Kayenta/Flagger). The Analyzer sends pass/fail signals to the Deployment Controller (Argo Rollouts), which updates traffic weights in the Service Mesh. The Model Registry triggers new rollouts through the Deployment Controller.
How to Implement
Implementation Approaches
There are three primary approaches to implementing canary deployments for ML models, each suited to different infrastructure maturity levels:
Approach 1: Kubernetes-native with Argo Rollouts + Istio. This is the gold standard for teams running on Kubernetes. Argo Rollouts provides the deployment controller with native canary strategy support, Istio handles traffic splitting via VirtualService resources, and Prometheus provides the metrics backbone. This approach gives you maximum control and works for any model serving framework (TFServing, Triton, custom Flask/FastAPI servers).
Approach 2: ML platform-native canary. If you use KServe (formerly KFServing) or Seldon Core for model serving, canary deployment is built in. KServe's canaryTrafficPercent field and Seldon's traffic splitting via Istio integration handle the routing automatically. This is simpler to set up but ties you to the platform's serving abstractions.
Approach 3: Cloud-managed canary. AWS SageMaker, Google Vertex AI, and Azure ML all offer managed canary deployment features. SageMaker's deployment guardrails support linear and all-at-once traffic shifting with automatic rollback based on CloudWatch alarms. Vertex AI supports traffic splitting across model versions with a single API call. This is the lowest-effort option but offers the least customization.
Cost Comparison (India): Running Argo Rollouts + Istio on a 3-node EKS cluster costs approximately ₹25,000-40,000/month (215 USD) but charges additionally per inference. For a startup in Bengaluru processing 1M inferences/day, the Kubernetes approach becomes more cost-effective above ~5M inferences/day.
apiVersion: argoproj.io/v1alpha1
kind: Rollout
metadata:
  name: recommendation-model
  namespace: ml-serving
spec:
  replicas: 4
  revisionHistoryLimit: 3
  selector:
    matchLabels:
      app: recommendation-model
  template:
    metadata:
      labels:
        app: recommendation-model
    spec:
      containers:
        - name: model-server
          image: registry.example.com/rec-model:v2.3.1
          ports:
            - containerPort: 8080
          resources:
            requests:
              cpu: "2"
              memory: "4Gi"
            limits:
              cpu: "4"
              memory: "8Gi"
          readinessProbe:
            httpGet:
              path: /health
              port: 8080
            initialDelaySeconds: 30
            periodSeconds: 10
  strategy:
    canary:
      # Traffic routing via Istio VirtualService
      trafficRouting:
        istio:
          virtualService:
            name: recommendation-model-vsvc
            routes:
              - primary
          destinationRule:
            name: recommendation-model-destrule
            canarySubsetName: canary
            stableSubsetName: stable
      # Gradual traffic ramp schedule
      steps:
        - setWeight: 1
        - pause: { duration: 10m }   # Bake at 1%
        - setWeight: 5
        - pause: { duration: 15m }   # Bake at 5%
        - analysis:
            templates:
              - templateName: canary-analysis
            args:
              - name: service-name
                value: recommendation-model
        - setWeight: 10
        - pause: { duration: 20m }
        - setWeight: 25
        - pause: { duration: 30m }
        - analysis:
            templates:
              - templateName: canary-analysis
            args:
              - name: service-name
                value: recommendation-model
        - setWeight: 50
        - pause: { duration: 60m }
        - setWeight: 100
      # Automatic rollback on failure
      rollbackWindow:
        revisions: 1
This Argo Rollout manifest defines a canary strategy for an ML recommendation model. The steps array implements a gradual traffic ramp: 1% -> 5% -> 10% -> 25% -> 50% -> 100%, with bake periods at each stage. The analysis steps trigger automated canary analysis (defined separately as an AnalysisTemplate) at the 5% and 25% gates. If analysis fails at any point, Argo Rollouts automatically rolls back to the stable version. The Istio integration configures a VirtualService to handle the actual request routing.
apiVersion: argoproj.io/v1alpha1
kind: AnalysisTemplate
metadata:
  name: canary-analysis
  namespace: ml-serving
spec:
  args:
    - name: service-name
  metrics:
    # Infrastructure: Error rate must stay below 1%
    - name: error-rate
      interval: 2m
      count: 5
      successCondition: result[0] < 0.01
      failureCondition: result[0] >= 0.05
      failureLimit: 2
      provider:
        prometheus:
          address: http://prometheus.monitoring:9090
          query: |
            sum(rate(
              http_requests_total{service="{{args.service-name}}",
              rollouts_pod_template_hash="{{templates.podTemplateHash}}",
              status=~"5.."}[5m]
            )) /
            sum(rate(
              http_requests_total{service="{{args.service-name}}",
              rollouts_pod_template_hash="{{templates.podTemplateHash}}"}[5m]
            ))
    # Infrastructure: P99 latency must stay below 200ms
    - name: latency-p99
      interval: 2m
      count: 5
      successCondition: result[0] < 200
      failureCondition: result[0] >= 500
      failureLimit: 2
      provider:
        prometheus:
          address: http://prometheus.monitoring:9090
          query: |
            histogram_quantile(0.99,
              sum(rate(
                http_request_duration_ms_bucket{service="{{args.service-name}}",
                rollouts_pod_template_hash="{{templates.podTemplateHash}}"}[5m]
              )) by (le)
            )
    # Model quality: Prediction confidence distribution
    - name: prediction-confidence
      interval: 5m
      count: 3
      successCondition: result[0] > 0.65
      failureCondition: result[0] < 0.50
      failureLimit: 1
      provider:
        prometheus:
          address: http://prometheus.monitoring:9090
          query: |
            avg(
              ml_prediction_confidence{service="{{args.service-name}}",
              rollouts_pod_template_hash="{{templates.podTemplateHash}}"}
            )
This AnalysisTemplate defines the automated canary gates. Three metrics are monitored: HTTP error rate (must stay below 1%, hard fail at 5%), P99 latency (must stay below 200ms), and ML-specific prediction confidence (average must exceed 0.65). Each metric is evaluated every 2-5 minutes with configurable failure limits -- a single bad reading does not trigger rollback, but sustained degradation does. The failureLimit parameter prevents flapping caused by transient metric noise.
apiVersion: serving.kserve.io/v1beta1
kind: InferenceService
metadata:
  name: fraud-detection
  namespace: ml-serving
  annotations:
    serving.kserve.io/deploymentMode: RawDeployment
spec:
  predictor:
    # Canary receives 10% of traffic
    canaryTrafficPercent: 10
    model:
      modelFormat:
        name: sklearn
      storageUri: gs://ml-models/fraud-detection/v2.1.0
      resources:
        requests:
          cpu: "1"
          memory: "2Gi"
        limits:
          cpu: "2"
          memory: "4Gi"
      runtime: kserve-sklearnserver
---
# Previous stable version is automatically tracked by KServe.
# To promote canary to stable, set canaryTrafficPercent: 0
# (or remove the field) and update the storageUri.
# To rollback, set canaryTrafficPercent: 0 without updating storageUri.
KServe simplifies canary deployments for ML models by managing traffic splitting internally. When you set canaryTrafficPercent, KServe automatically keeps the last known stable revision and routes the specified percentage to the new version. This is ideal for teams that want canary functionality without managing Argo Rollouts and Istio separately. The tradeoff is less control over the ramp schedule and analysis -- you typically pair this with an external monitoring system for the statistical analysis.
import numpy as np
from scipy import stats
from dataclasses import dataclass
from enum import Enum
from typing import Optional


class Verdict(Enum):
    PASS = "pass"
    FAIL = "fail"
    MARGINAL = "marginal"


@dataclass
class MetricConfig:
    name: str
    weight: float = 1.0
    direction: str = "higher_is_better"  # or "lower_is_better"
    margin: float = 0.05  # non-inferiority margin (relative)
    alpha: float = 0.05   # significance level


@dataclass
class MetricResult:
    name: str
    canary_mean: float
    stable_mean: float
    p_value: float
    passed: bool
    effect_size: float


def analyze_canary_metric(
    canary_samples: np.ndarray,
    stable_samples: np.ndarray,
    config: MetricConfig,
) -> MetricResult:
    """Run non-inferiority test comparing canary vs stable."""
    canary_mean = np.mean(canary_samples)
    stable_mean = np.mean(stable_samples)

    # Compute effect size (Cohen's d)
    pooled_std = np.sqrt(
        (np.var(canary_samples) + np.var(stable_samples)) / 2
    )
    effect_size = (canary_mean - stable_mean) / pooled_std if pooled_std > 0 else 0.0

    # Non-inferiority test using Mann-Whitney U
    # (robust to non-normal distributions common in ML metrics)
    if config.direction == "higher_is_better":
        # Test: canary >= stable - margin
        shifted_stable = stable_samples - abs(stable_mean * config.margin)
        stat, p_value = stats.mannwhitneyu(
            canary_samples, shifted_stable, alternative="greater"
        )
        passed = p_value < config.alpha
    else:
        # Test: canary <= stable + margin (lower is better, e.g., latency)
        shifted_stable = stable_samples + abs(stable_mean * config.margin)
        stat, p_value = stats.mannwhitneyu(
            canary_samples, shifted_stable, alternative="less"
        )
        passed = p_value < config.alpha

    return MetricResult(
        name=config.name,
        canary_mean=float(canary_mean),
        stable_mean=float(stable_mean),
        p_value=float(p_value),
        passed=passed,
        effect_size=float(effect_size),
    )


def compute_canary_score(
    results: list[MetricResult],
    configs: list[MetricConfig],
) -> tuple[float, Verdict]:
    """Compute weighted aggregate canary score and verdict."""
    total_weight = sum(c.weight for c in configs)
    weighted_pass = sum(
        c.weight for c, r in zip(configs, results) if r.passed
    )
    score = (weighted_pass / total_weight) * 100

    if score >= 95:
        verdict = Verdict.PASS
    elif score <= 60:
        verdict = Verdict.FAIL
    else:
        verdict = Verdict.MARGINAL

    return score, verdict


# --- Example usage ---
if __name__ == "__main__":
    np.random.seed(42)

    # Simulate metrics from production
    metrics_config = [
        MetricConfig("click_through_rate", weight=3.0, direction="higher_is_better"),
        MetricConfig("p99_latency_ms", weight=2.0, direction="lower_is_better"),
        MetricConfig("prediction_confidence", weight=1.5, direction="higher_is_better"),
        MetricConfig("error_rate", weight=2.5, direction="lower_is_better", margin=0.01),
    ]

    results = []
    for config in metrics_config:
        # Simulated canary and stable samples
        stable = np.random.normal(loc=0.12, scale=0.02, size=5000)
        canary = np.random.normal(loc=0.125, scale=0.02, size=500)  # 10% traffic
        result = analyze_canary_metric(canary, stable, config)
        results.append(result)
        print(f"{result.name}: canary={result.canary_mean:.4f}, "
              f"stable={result.stable_mean:.4f}, p={result.p_value:.4f}, "
              f"pass={result.passed}")

    score, verdict = compute_canary_score(results, metrics_config)
    print(f"\nCanary Score: {score:.1f} -> {verdict.value}")
This Python implementation shows the core statistical engine behind canary analysis. For each metric, it performs a Mann-Whitney U non-inferiority test -- chosen because ML prediction metrics are rarely normally distributed (latency has long tails, click rates are binary, confidence scores are bounded). The margin parameter defines how much worse the canary can be before we consider it a regression. The weighted aggregate score mirrors the Kayenta scoring approach. In production, this logic would be wrapped in a Kubernetes Job triggered by Argo Rollouts' AnalysisTemplate.
import numpy as np
from scipy.stats import ks_2samp
from dataclasses import dataclass
from datetime import datetime, timedelta


@dataclass
class RollbackTrigger:
    name: str
    severity: str  # "critical", "warning"
    message: str
    timestamp: datetime


def check_prediction_distribution_shift(
    canary_predictions: np.ndarray,
    stable_predictions: np.ndarray,
    ks_threshold: float = 0.05,
) -> RollbackTrigger | None:
    """Detect if canary prediction distribution diverges from stable."""
    stat, p_value = ks_2samp(canary_predictions, stable_predictions)

    if p_value < ks_threshold and stat > 0.1:
        return RollbackTrigger(
            name="prediction_distribution_shift",
            severity="critical",
            message=(
                f"Canary prediction distribution significantly differs from stable. "
                f"KS statistic={stat:.4f}, p-value={p_value:.6f}. "
                f"This may indicate a model bug or data pipeline issue."
            ),
            timestamp=datetime.utcnow(),
        )
    return None


def check_error_rate_spike(
    canary_error_rate: float,
    stable_error_rate: float,
    absolute_threshold: float = 0.05,
    relative_multiplier: float = 3.0,
) -> RollbackTrigger | None:
    """Trigger rollback if canary errors spike."""
    if canary_error_rate > absolute_threshold:
        return RollbackTrigger(
            name="absolute_error_spike",
            severity="critical",
            message=f"Canary error rate {canary_error_rate:.2%} exceeds absolute threshold {absolute_threshold:.2%}",
            timestamp=datetime.utcnow(),
        )
    if stable_error_rate > 0 and canary_error_rate > stable_error_rate * relative_multiplier:
        return RollbackTrigger(
            name="relative_error_spike",
            severity="critical",
            message=(
                f"Canary error rate {canary_error_rate:.2%} is {canary_error_rate/stable_error_rate:.1f}x "
                f"the stable error rate {stable_error_rate:.2%}"
            ),
            timestamp=datetime.utcnow(),
        )
    return None


def check_latency_degradation(
    canary_p99_ms: float,
    stable_p99_ms: float,
    absolute_max_ms: float = 500.0,
    relative_max_ratio: float = 2.0,
) -> RollbackTrigger | None:
    """Trigger rollback if canary latency degrades beyond thresholds."""
    if canary_p99_ms > absolute_max_ms:
        return RollbackTrigger(
            name="latency_absolute_breach",
            severity="critical",
            message=f"Canary P99 latency {canary_p99_ms:.0f}ms exceeds max {absolute_max_ms:.0f}ms",
            timestamp=datetime.utcnow(),
        )
    if canary_p99_ms > stable_p99_ms * relative_max_ratio:
        return RollbackTrigger(
            name="latency_relative_breach",
            severity="warning",
            message=(
                f"Canary P99 latency {canary_p99_ms:.0f}ms is {canary_p99_ms/stable_p99_ms:.1f}x "
                f"the stable P99 {stable_p99_ms:.0f}ms"
            ),
            timestamp=datetime.utcnow(),
        )
    return None


# --- Example: Evaluate all rollback triggers ---
if __name__ == "__main__":
    triggers = []

    # Check prediction distribution
    canary_preds = np.random.beta(2, 5, size=500)
    stable_preds = np.random.beta(2, 5, size=5000)
    trigger = check_prediction_distribution_shift(canary_preds, stable_preds)
    if trigger:
        triggers.append(trigger)

    # Check error rate
    trigger = check_error_rate_spike(canary_error_rate=0.003, stable_error_rate=0.002)
    if trigger:
        triggers.append(trigger)

    # Check latency
    trigger = check_latency_degradation(canary_p99_ms=180.0, stable_p99_ms=150.0)
    if trigger:
        triggers.append(trigger)

    if not triggers:
        print("All checks passed. Safe to continue canary rollout.")
    else:
        for t in triggers:
            print(f"[{t.severity.upper()}] {t.name}: {t.message}")
This rollback decision engine implements the three most critical automated checks for ML canary deployments: prediction distribution shift (using a two-sample Kolmogorov-Smirnov test to detect if the canary's output distribution diverges from the stable model), error rate spikes (both absolute and relative thresholds), and latency degradation (with both hard caps and relative comparisons). In production, these checks run continuously during the bake period and can trigger immediate rollback without waiting for the full analysis cycle to complete.
# Flagger canary analysis configuration (HelmRelease values)
canary:
  # Deployment target ref
  targetRef:
    apiVersion: apps/v1
    kind: Deployment
    name: recommendation-model
  # Service mesh provider
  provider: istio
  # Analysis configuration
  analysis:
    # Schedule: analyze every 2 minutes
    interval: 2m
    # Number of successful checks before promotion
    threshold: 10
    # Max traffic weight during canary
    maxWeight: 50
    # Traffic weight increment per step
    stepWeight: 5
    # Prometheus metrics for automated analysis
    metrics:
      - name: request-success-rate
        thresholdRange:
          min: 99
        interval: 1m
      - name: request-duration
        thresholdRange:
          max: 200
        interval: 1m
      - name: ml-prediction-confidence
        thresholdRange:
          min: 0.65
        interval: 2m
    # Webhook for custom ML metric analysis
    webhooks:
      - name: ml-canary-analysis
        type: rollout
        url: http://canary-analyzer.ml-platform:8080/analyze
        timeout: 60s
        metadata:
          model: recommendation-model
          metrics: "ndcg,ctr,conversion_rate"
Common Implementation Mistakes
- ●
Comparing canary metrics against a static baseline instead of the live stable model: Historic baselines drift as traffic patterns change (time of day, day of week, seasonality). Always compare canary against the concurrent stable model receiving traffic from the same population. Comparing against last week's numbers will produce false positives and false negatives.
- ●
Setting canary traffic too high initially: Starting at 10% or higher means your blast radius is already significant. For a service handling 10M requests/day, 10% means 1M requests hit an untested model. Start at 1% -- 100K requests is enough for most statistical tests and limits damage if the model is broken.
- ●
Ignoring the cold-start effect: New model servers have cold caches, unoptimized JIT compilation, and unwarmed connection pools. The first few minutes of canary metrics will show worse latency than steady state. Include a warm-up pause (2-5 minutes) before beginning canary analysis to avoid false rollbacks.
- ●
Not segmenting canary metrics: Aggregate metrics can mask segment-level regressions. If your canary model degrades predictions for users in tier-2 Indian cities but improves for metro users, the aggregate might look fine. Always configure segment-level analysis for critical dimensions (geography, user tier, device type, request category).
- ●
Using the same analysis criteria for all metric types: Infrastructure metrics (error rate, latency) need tight, absolute thresholds -- a 5x error rate increase is never acceptable. Business metrics (CTR, conversion) need statistical tests with adequate sample size because they are inherently noisy. Applying the same threshold logic to both leads to either too many false rollbacks or missed regressions.
- ●
Forgetting to test the rollback path: Teams obsess over the promotion flow and never test that rollback actually works. Run a chaos test: deploy a known-bad model, verify the canary analysis catches it, and confirm that rollback completes within your SLA (typically < 30 seconds for traffic rerouting).
- ●
Not accounting for request stickiness: If your service mesh routes by session or user ID, the same users always hit the canary. This creates correlation in your samples and violates the independence assumption in statistical tests. Use random per-request routing unless you specifically need session affinity for the analysis.
When Should You Use This?
Use When
You are updating ML models in production that serve real user traffic and incorrect predictions have measurable business impact (revenue, user experience, safety)
Your model serving infrastructure supports traffic splitting (Kubernetes + Istio, cloud-managed endpoints, or load balancer with weighted routing)
You have monitoring infrastructure that can collect and compare metrics between two concurrent model versions in real time
You need automated safety gates that can roll back without human intervention within minutes -- critical for teams operating across time zones or deploying outside business hours
Your organization deploys model updates frequently (weekly or more) and manual validation does not scale
You need to comply with regulatory requirements that mandate gradual rollout and documented validation before full production deployment (common in fintech, healthcare, and insurance ML applications in India)
The model is too complex or the input distribution too diverse for offline evaluation alone to guarantee production safety
Avoid When
Your model serves batch predictions (offline scoring) rather than real-time inference -- canary is designed for online serving; for batch, use shadow scoring and output comparison instead
Traffic volume is too low to achieve statistical significance within a reasonable bake time. If your service handles fewer than 1,000 requests per hour, you will need very long bake periods (days) that negate the speed benefit of canary
The cost of running two model versions simultaneously is prohibitive. GPU-served LLMs on A100s can cost ₹1,500-3,000/hour ($18-36 USD/hour); doubling that for canary + stable may not be justified for infrequent deployments
You need to measure long-term business impact (e.g., user retention over weeks). Canary bake periods are hours, not weeks -- use A/B testing for longer-horizon experiments
Your model outputs have no measurable online metric (e.g., an anomaly detection model where ground truth only arrives weeks later). Without timely metrics, canary analysis cannot make informed decisions
You are doing a complete model architecture change that requires feature store updates, schema changes, or different input preprocessing. These changes need blue-green deployment with a full cutover, not gradual traffic splitting on the same API contract
Key Tradeoffs
Speed vs. Safety
The fundamental tradeoff in canary deployment is rollout speed vs. detection sensitivity. Aggressive ramp schedules (1% -> 25% -> 100% in 30 minutes) deploy faster but may miss subtle regressions that only become statistically detectable with larger sample sizes. Conservative schedules (1% -> 5% -> 10% -> 25% -> 50% -> 100% over 4 hours) catch more issues but delay the benefits of the new model and increase the cost of running two versions simultaneously.
| Schedule Type | Total Duration | Blast Radius (Worst Case) | Detection Sensitivity | Best For |
|---|---|---|---|---|
| Aggressive | 30-60 min | 25% of traffic for ~15 min | Low (catches only large regressions) | Low-risk models, frequent deploys |
| Standard | 2-4 hours | 10% of traffic for ~30 min | Medium | Most production models |
| Conservative | 4-8 hours | 5% of traffic for ~60 min | High (catches subtle regressions) | Revenue-critical, safety-critical models |
Infrastructure Cost
During canary analysis, you run two model versions simultaneously. For CPU-served models, the overhead is typically 10-20% of the stable deployment's cost (since the canary handles only a fraction of traffic). For GPU-served models, the overhead is more significant because GPU allocation is coarse-grained -- you often need at least one full GPU for the canary even if it handles only 1% of traffic.
For an Indian fintech company serving a fraud detection model on 2x NVIDIA T4 GPUs (₹50,000/month or ~3.30) per deployment. With daily deploys, that is ₹8,250/month ($100/month) -- a reasonable insurance premium.
Metric Coverage vs. Analysis Complexity
Monitoring more metrics during canary analysis catches more types of regressions but increases the probability of false positives (type I errors) due to multiple hypothesis testing. With 20 metrics tested at , you expect one false failure per canary even when the model is perfectly fine. Apply Bonferroni correction () or use a hierarchical approach: hard-gate on 3-4 critical metrics, soft-gate (advisory) on the rest.
Alternatives & Comparisons
Blue-green deployment switches 100% of traffic between two identical environments atomically. It is simpler to implement (no traffic splitting needed) and provides instant rollback by reverting the DNS or load balancer target. Choose blue-green when you need atomic cutover (e.g., schema-breaking model changes), when traffic volume is too low for meaningful canary analysis, or when the model change is so fundamental that gradual comparison is not meaningful. Choose canary when you need granular risk control, automated metric-based promotion, and the ability to detect subtle regressions through statistical comparison.
In shadow mode, the new model receives a copy of production traffic but its responses are discarded -- only logged for analysis. Shadow mode has zero user impact, making it ideal for high-risk changes (new model architectures, different output schemas). Choose shadow mode when you cannot tolerate any degradation in user experience during validation. Choose canary when you need to measure metrics that require actual user interaction (click-through rate, conversion) or when the cost of duplicating inference traffic is prohibitive (shadow mode doubles compute cost at 100% traffic).
Feature flags route specific user segments (e.g., internal users, beta testers, a specific geographic region) to the new model version. This gives more deterministic control over who sees the new model. Choose feature flags when you need targeted rollout to specific user cohorts (e.g., testing a Hindi language model only on users in North India). Choose canary when you need random traffic sampling for unbiased statistical comparison -- feature flags introduce selection bias by design.
Multi-armed bandit (MAB) deployment dynamically allocates traffic to the best-performing model version, maximizing reward during the exploration phase. Unlike canary (which uses fixed ramp schedules), MAB adapts traffic allocation based on real-time performance. Choose MAB when you want to minimize the opportunity cost of serving a worse model during evaluation. Choose canary when you need a clear safety gate with deterministic rollback semantics -- MAB is harder to reason about and debug when things go wrong.
Pros, Cons & Tradeoffs
Advantages
Minimized blast radius: Only a small fraction of users (1-5%) are exposed to potential regressions during initial validation, limiting revenue and experience impact to a controlled slice of traffic
Automated safety gates: Statistical analysis replaces human judgment for go/no-go decisions, enabling continuous deployment at scale without fatiguing on-call engineers. Netflix runs thousands of canary analyses per day -- no human could review them all
Real production validation: Tests the model against actual traffic patterns, data distributions, and infrastructure conditions that cannot be fully replicated in staging environments. This catches issues that offline evaluation misses: cold-start behavior, cache interactions, edge-case inputs, and load-dependent latency
Instant rollback capability: If the canary fails, traffic reverts to the stable version within seconds (Istio VirtualService update) to minutes (pod termination). No data migration, no state reconciliation -- just route the traffic away
Quantitative deployment confidence: The canary score provides a numerical measure of deployment safety, creating an auditable record for compliance and post-incident review. Especially valuable for regulated industries in India (RBI guidelines for AI in banking, IRDAI for insurance)
Enables high deployment velocity: Teams can deploy model updates daily or even multiple times per day because the canary acts as an automated quality gate. Without canary, risk aversion leads to infrequent deploys with large, hard-to-debug change sets
Compatible with existing serving infrastructure: Works with any model server (TFServing, Triton, BentoML, custom Flask/FastAPI) as long as the traffic router can split requests. No changes to the model itself are required
Disadvantages
Requires traffic splitting infrastructure: You need a service mesh (Istio, Linkerd), ingress controller with weighted routing, or cloud-managed traffic splitting. This adds operational complexity and is a prerequisite many teams underestimate
Doubled infrastructure during analysis: Running two model versions simultaneously increases compute cost. For GPU-intensive models (LLMs, large vision models), this can be expensive -- an additional A100 GPU for the canary at ₹2,50,000/month (~$3,000 USD/month) adds up quickly
Statistical sensitivity limited by traffic volume: Low-traffic services (< 1,000 RPM) cannot detect small regressions within reasonable bake times. A 2% CTR drop requires ~40,000 samples per group to detect with 80% power at
Cold-start artifacts confound analysis: New model pods have cold caches, uncompiled code, and empty connection pools. Initial metrics are worse than steady state, requiring warm-up periods that delay the analysis cycle and can cause false rollbacks
Multiple testing problem: Monitoring many metrics simultaneously inflates the false positive rate. With 15 metrics at , the family-wise error rate approaches 54%, meaning you will trigger spurious rollbacks frequently without correction
Cannot measure long-term effects: Canary bake periods are hours, not weeks. Effects that manifest over time (user churn from subtly worse recommendations, gradual trust erosion from a less accurate fraud model) are invisible to canary analysis. These require post-deployment A/B testing
Request stickiness can bias results: If the load balancer uses session-based routing, the same users always see the canary, violating the independent sampling assumption. This creates correlated samples that inflate statistical significance artificially
Failure Modes & Debugging
Silent quality regression passes canary
Cause
Canary metrics are too coarse to detect the regression. For example, monitoring only aggregate accuracy while the model degrades on a specific user segment (e.g., new users, users in tier-2 cities, a specific product category). The aggregate metric looks fine because the affected segment is small.
Symptoms
Canary analysis passes, model is promoted to 100%, and days later business teams report declining metrics for specific segments. Post-mortem reveals the regression was present in canary data but not captured by the configured metrics.
Mitigation
Configure segment-level canary metrics for all critical dimensions. For an e-commerce recommendation model, this means separate analysis for user tiers, geographic regions, product categories, and device types. Use stratified analysis in the canary analyzer to catch segment-specific regressions that aggregate metrics mask.
False rollback from cold-start latency spike
Cause
The canary model server has just started and is experiencing cold JVM, empty model cache, or unestablished connection pools. The first 2-5 minutes of traffic show elevated latency (2-5x normal) that triggers the latency rollback threshold.
Symptoms
Canary rollback triggered within the first few minutes of deployment, despite the model itself being correct. The same model version, when redeployed, sometimes passes (if warmup happens faster) and sometimes fails, creating flaky deployments.
Mitigation
Add a warmup phase before canary analysis begins. Configure Kubernetes readiness probes to only pass after the model is loaded and warmed up. Use Argo Rollouts' initialDelay in analysis templates. Send synthetic warmup requests to the canary before opening it to real traffic.
Canary-stable metric divergence from infrastructure asymmetry
Cause
The canary and stable deployments run on different node types, different availability zones, or have different resource limits. Performance differences are caused by infrastructure, not the model, but the canary analyzer attributes them to the model version.
Symptoms
Consistent metric differences between canary and stable that do not correspond to model quality changes. Latency is always 10-15% higher on canary regardless of the model version deployed. The team learns to ignore the canary results, defeating its purpose.
Mitigation
Ensure infrastructure parity between canary and stable: same node pools (or node affinity labels), same resource requests/limits, same autoscaling configuration. Use Kubernetes PodAntiAffinity to spread canary and stable pods across the same set of nodes. Validate parity by deploying the same model version as both canary and stable and confirming metrics converge.
Multiple testing false positives causing deployment gridlock
Cause
Too many metrics configured with independent significance tests. With metrics at , the probability of at least one false positive is . Every canary analysis triggers at least one spurious failure.
Symptoms
Canary rollouts fail frequently despite the model being correct. Engineers start overriding canary results manually ("just promote it, the canary is broken again"), which defeats the purpose of automated safety gates.
Mitigation
Apply Bonferroni correction or Benjamini-Hochberg FDR control to adjust significance levels for multiple comparisons. Alternatively, use a hierarchical approach: hard-gate on 3-5 critical metrics (error rate, latency P99, primary business metric) and soft-gate (advisory, non-blocking) on secondary metrics. Reduce the total number of gating metrics to minimize the false positive rate.
Rollback mechanism failure under load
Cause
The rollback path has not been tested under production conditions. The Istio VirtualService update takes longer than expected due to Envoy proxy reconfiguration propagation delay, or the canary pods are not terminated cleanly, leaving stale connections serving bad predictions.
Symptoms
Canary analysis correctly identifies a regression and triggers rollback, but traffic continues flowing to the canary for 1-5 minutes after the rollback signal due to proxy configuration propagation delay. During this window, users experience degraded predictions.
Mitigation
Test the rollback path regularly with intentional bad deployments (chaos engineering). Measure and monitor the actual rollback latency -- the time from rollback decision to zero canary traffic. Set Envoy's drainDuration appropriately. Consider running a circuit breaker at the application level that can reject requests faster than the mesh reconfiguration.
Canary traffic not representative of full population
Cause
The traffic router uses session-based or geography-based routing that sends a non-random subset of traffic to the canary. For example, Istio's consistent hashing routes the same users to the canary every time, creating a biased sample.
Symptoms
Canary analysis results are not reproducible -- deploying the same model version multiple times gives different canary scores. Business metrics measured during canary do not match post-promotion metrics because the canary was evaluated on a non-representative population.
Mitigation
Use random per-request routing (Istio's weighted round-robin, not consistent hash) for canary traffic splitting. If session affinity is required for the application (e.g., stateful conversations), use a separate randomization layer that assigns users to canary/stable at session creation time, ensuring the assignment is uniformly random.
Placement in an ML System
Where Canary Deployment Fits in the ML System
Canary deployment sits at the boundary between the model development lifecycle and the production serving infrastructure. It is the final automated gate before a model version gains full production status.
Upstream: The model registry provides the new model artifact, tagged as a production candidate. The CI/CD pipeline has already validated the model through offline evaluation (accuracy, bias checks, performance benchmarks). The canary deployment picks up where offline validation leaves off -- it validates the model against live traffic.
Downstream: Once promoted, the model becomes the new stable version in the serving infrastructure. The metrics collector continues monitoring post-promotion (the canary analysis metrics become the baseline for ongoing drift detection). If drift detection later identifies degradation, it may trigger a rollback to a previous version or flag the model for retraining.
In a mature MLOps pipeline, canary deployment is one stage in a multi-gate deployment process: offline evaluation -> shadow deployment (optional) -> canary deployment -> full production -> continuous monitoring. Each gate progressively increases confidence in the model's production readiness.
Coordination with Feature Flags: Some organizations combine canary deployment with feature flags. The canary handles infrastructure-level traffic splitting (is the model safe?), while feature flags handle product-level targeting (which users should see this model?). Flipkart's ML platform, for instance, uses this layered approach to roll out new ranking models to specific product categories before expanding to the full catalog.
Pipeline Stage
Deployment / Serving
Upstream
- model-registry
- model-serving
- load-balancer
Downstream
- metrics-collector
- drift-detection
- model-serving
Scaling Bottlenecks
The primary bottleneck is inference infrastructure cost. During canary analysis, you maintain two model deployments. For CPU models this is modest (a few extra pods), but for GPU models the cost scales with GPU granularity -- even at 1% traffic, you may need a full GPU for the canary. At companies running hundreds of models (Uber runs thousands), the aggregate canary overhead becomes significant: if 50 models are in canary simultaneously, that is 50 extra GPU allocations.
The second bottleneck is metrics pipeline throughput. Canary analysis queries Prometheus or Datadog every 1-2 minutes across multiple metrics and dimensions. At scale (100+ concurrent canaries), this can overwhelm the metrics backend. Use recording rules in Prometheus to pre-aggregate canary metrics and reduce query-time computation.
The third bottleneck is analysis parallelism. Each canary analysis involves multiple statistical tests. If the canary analyzer is a single service processing all analyses sequentially, it becomes a bottleneck. Netflix's Kayenta handles this through horizontal scaling of the analysis service, but self-hosted setups often underestimate this requirement.
Production Case Studies
Netflix developed Kayenta, an open-source automated canary analysis tool, jointly with Google. Kayenta runs statistical tests on user-specified metrics (latency, error rates, business KPIs) and returns an aggregate score (success, marginal, failure). It integrates with Spinnaker for deployment orchestration and supports metrics from Prometheus, Datadog, Stackdriver, and Netflix's internal Atlas system. Netflix uses Kayenta for all production deployments including ML model updates, running thousands of automated canary analyses per day.
Reduced human-in-the-loop deployment validation time by over 90%. Canary analysis catches regressions that manual review missed, while automated promotion reduces deployment lead time from hours to minutes. The system processes thousands of canary analyses daily with a false positive rate below 5%.
Uber's ML platform Michelangelo implements a three-stage validation pipeline for every model update: staging integration tests, canary integration tests, and production rollout. Canary tests run the new model against live production traffic at low weight while comparing key metrics (latency, prediction quality, feature freshness) against the stable version. With thousands of models in production, many retrained daily or weekly, automated canary gates are essential to maintain safety at scale without bottlenecking on human review.
Uber reports that automated canary gates catch approximately 15-20% of model deployments with regressions before they reach full production. The system maintains a consistent safety baseline across thousands of production models without slowing down individual team deployment velocity.
Google co-developed Kayenta with Netflix and uses canary analysis extensively across its infrastructure, including for Search ranking model updates. Google tests changes on 8.5 billion daily searches using graduated rollout with automated metric comparison. The canary system evaluates hundreds of quality metrics simultaneously using a hierarchical analysis framework that manages the multiple testing problem through metric grouping and weighted aggregation.
Google's canary analysis framework enables rapid iteration on search ranking models while protecting the quality experience of billions of daily queries. The hierarchical metric framework reduces false positive rollbacks by grouping related metrics and testing at the group level.
DoorDash's ML platform supports ~200 production models handling 500+ billion predictions per week. Their deployment pipeline includes model shadowing (dark launch) followed by canary deployment for progressive validation. The platform uses Envoy-based traffic splitting with automated analysis to canary new model versions for their restaurant ranking, delivery time estimation, and fraud detection models. They migrated to an Istio service mesh specifically to enable fine-grained canary traffic control.
DoorDash's canary deployment pipeline reduced model deployment incidents by approximately 60% after implementation. The shadow-then-canary approach provides two layers of validation, catching both functional bugs (shadow phase) and performance regressions (canary phase).
Tooling & Ecosystem
Kubernetes controller for progressive delivery. Provides first-class canary and blue-green deployment strategies with automated analysis integration. Supports traffic splitting via Istio, NGINX, ALB, and other providers. The de facto standard for Kubernetes-native canary deployments.
Progressive delivery operator for Kubernetes by the Flux project (CNCF). Automates canary analysis using metrics from Prometheus, Datadog, CloudWatch, and others. Supports Istio, Linkerd, App Mesh, Contour, and NGINX for traffic routing. Tightly integrated with GitOps workflows via Flux.
Automated canary analysis service developed by Netflix and Google. Performs statistical analysis on canary vs. baseline metrics and returns aggregate pass/fail/marginal scores. Integrates with Spinnaker for deployment orchestration. Supports multiple metrics providers (Prometheus, Datadog, Stackdriver, Atlas).
Kubernetes-native model serving platform with built-in canary deployment support via the canaryTrafficPercent field. Automatically tracks stable and canary revisions, enabling one-line traffic splitting for ML model rollouts. Part of the Kubeflow ecosystem.
Open-source ML model serving platform for Kubernetes. Supports canary deployments, A/B testing, and multi-armed bandit routing via Istio integration. Provides a high-level SeldonDeployment CRD with traffic splitting built into the deployment spec.
Service mesh that provides the traffic splitting layer for canary deployments. VirtualService and DestinationRule resources enable weighted routing between canary and stable model versions. Works with Argo Rollouts, Flagger, and custom controllers.
Managed canary deployment for SageMaker endpoints. Supports linear and all-at-once traffic shifting with automatic rollback based on CloudWatch alarms. No infrastructure management required -- ideal for teams fully on AWS.
Managed model deployment with traffic splitting across model versions. Supports gradual rollout by specifying traffic percentage per model version on a single endpoint. Integrates with Cloud Monitoring for automated rollback.
Research & References
Paleyes, Urma & Lawrence (2022)ACM Computing Surveys
Comprehensive survey reviewing published reports of deploying ML solutions across industries. Identifies deployment strategies (including canary releases) as a key challenge area and documents common failure modes in production ML systems.
Uber Engineering (2023)Uber Engineering Blog
Describes Uber's CI/CD pipeline for ML models, including their three-stage canary testing framework that validates model safety before full production deployment across thousands of models.
John & Olsson (2022)arXiv preprint
Examines the adaptation of CI/CD practices for ML model deployment, covering canary strategies, automated testing gates, and the unique challenges of validating statistical model quality in deployment pipelines.
Dobbe et al. (2024)arXiv preprint
Proposes a formal framework for safe model updates, addressing how distribution shifts and evolving requirements demand continuous updates while ensuring benign parameter changes do not cause unintended regressions. Directly relevant to canary deployment validation criteria.
Santos et al. (2024)arXiv preprint
Covers the full MLOps lifecycle from experimentation through deployment (including canary and blue-green strategies) to production monitoring. Provides practical guidance on choosing between deployment strategies based on organizational maturity.
Shankar et al. (2022)arXiv preprint
Proposes end-to-end observability for deployed ML pipelines, addressing the lack of real-time feedback for predictions and silent failures. The observability framework described is essential for effective canary analysis of ML model quality.
Interview & Evaluation Perspective
Common Interview Questions
- ●
How would you design a canary deployment system for an ML model serving 50M predictions per day?
- ●
What metrics would you monitor during a canary rollout of a recommendation model, and how would you determine statistical significance?
- ●
How does canary deployment differ from A/B testing for ML models? When would you use each?
- ●
What happens if your canary analysis gives a marginal result -- neither clearly pass nor clearly fail?
- ●
How would you handle canary deployment for a GPU-intensive model like a large language model where running two versions is expensive?
- ●
Walk me through the rollback process when a canary fails. What could go wrong during rollback?
- ●
How do you prevent the multiple testing problem from causing false rollbacks when monitoring 20+ metrics?
Key Points to Mention
- ●
Canary deployment for ML models requires metric-based analysis, not just error rate monitoring. ML models fail silently -- they return valid responses with degraded quality. You must compare prediction distributions, confidence scores, and business metrics between canary and stable versions.
- ●
The non-inferiority test is the correct statistical framework for canary analysis. You are asking 'is the canary no worse than stable?' not 'is the canary better than stable?' This is a crucial distinction from A/B testing.
- ●
Always design for instant rollback (< 30 seconds). The rollback path should be simpler and faster than the promotion path. In Kubernetes + Istio, this means a single VirtualService weight update.
- ●
Address the cold-start problem explicitly: new model servers need warmup time. Include an initial warmup period before beginning metric comparison to avoid false rollbacks from cold cache effects.
- ●
Discuss blast radius calculation: at 5% canary traffic with 10M daily requests, 500K requests hit the canary. If the model is broken, that is 500K bad predictions. Quantify the business impact of this blast radius to justify your ramp schedule.
- ●
Mention the multiple testing correction (Bonferroni or FDR) when monitoring many metrics simultaneously. This shows awareness of a subtle but important statistical issue.
- ●
Reference real tools: Argo Rollouts + Istio for Kubernetes, Kayenta for statistical analysis, KServe's built-in canaryTrafficPercent for ML-native serving.
Pitfalls to Avoid
- ●
Treating canary deployment as identical to A/B testing -- they have different goals (safety vs. optimization), different duration (hours vs. weeks), and different statistical requirements (non-inferiority vs. superiority testing).
- ●
Ignoring the infrastructure cost of running two model versions simultaneously, especially for GPU-served models. An interviewer will expect you to discuss cost-aware ramp schedules.
- ●
Claiming that canary deployment catches all regressions -- it only catches regressions that are statistically detectable within the bake period with the configured metrics. Long-term effects and rare edge cases will be missed.
- ●
Not mentioning the rollback path. Every deployment strategy discussion should address: what happens when things go wrong, and how fast can we recover?
- ●
Describing only infrastructure metrics (latency, errors) without ML-specific metrics (prediction distribution, confidence, feature drift). This misses the core challenge of canary deployment for ML models.
Senior-Level Expectation
A senior/staff candidate should demonstrate end-to-end system thinking about canary deployment. This means discussing: (1) the full deployment pipeline from model registry trigger through canary creation, analysis, promotion/rollback, and post-promotion monitoring; (2) statistical rigor -- choosing appropriate tests, managing multiple comparisons, calculating required sample sizes and bake times; (3) failure mode analysis -- not just 'what if the model is bad' but 'what if the canary system itself fails' (analyzer crashes, metrics pipeline delays, service mesh misconfiguration); (4) cost optimization -- GPU sharing between canary and stable, spot instances for canary pods, reducing bake times safely; (5) organizational process -- who owns the canary configuration, how are metric thresholds set and updated, what is the escalation path for marginal results. The candidate should also discuss how canary deployment interacts with other deployment patterns (shadow mode as a pre-canary gate, feature flags for targeted rollout, A/B testing as a post-canary experiment) and reference specific tooling choices with justification.
Summary
Wrapping Up
Canary deployment is the safety net between your model development pipeline and your users. It solves the fundamental challenge of ML production systems: models fail silently, returning valid-looking predictions that are semantically wrong. By routing a small fraction of traffic to the new model and statistically comparing its performance against the incumbent, canary deployment catches regressions that offline evaluation, staging tests, and human review all miss.
The key components are: a traffic router (Istio VirtualService, cloud load balancer, or KServe's built-in splitting) that distributes requests between stable and canary versions; a metrics pipeline (Prometheus, Datadog) that collects infrastructure, model quality, and business metrics from both versions; a canary analyzer (Kayenta, Flagger, or custom statistical engine) that performs non-inferiority hypothesis tests and produces aggregate scores; and a deployment controller (Argo Rollouts, Flagger, or cloud-managed) that orchestrates the ramp schedule and executes promotion or rollback based on analysis results.
The critical design decisions are: ramp schedule (aggressive 30-minute rollout vs. conservative 4-hour rollout, balanced against your blast radius tolerance), metric selection (hard gates on infrastructure metrics, statistical comparison on business metrics, with Bonferroni correction for multiple testing), bake time per step (driven by traffic volume and the minimum detectable effect size), and rollback speed (test it regularly -- an untested rollback mechanism is no mechanism at all). For Indian startups, cloud-managed canary on SageMaker or Vertex AI is the quickest path to production safety; for teams on Kubernetes, Argo Rollouts with Istio provides the most flexible and widely adopted solution.
Remember: the goal of canary deployment is not to prove the new model is better -- that is A/B testing's job. The goal is to prove the new model is not worse. This non-inferiority framing is the key to designing effective canary analysis and choosing the right statistical tests.