FID Score in Machine Learning
The Fréchet Inception Distance (FID) is the de facto standard metric for evaluating generative image models — from GANs to diffusion models. Instead of comparing individual images pixel-by-pixel, FID measures the statistical similarity between the distribution of generated images and the distribution of real images.
Proposed by Martin Heusel et al. in their 2017 paper "GANs Trained by a Two Time-Scale Update Rule Converge to a Local Nash Equilibrium," FID transformed how we evaluate generative models. Before FID, we relied on the Inception Score (IS), which only looked at generated images without comparing them to real data. FID fixed this critical blind spot.
Today, FID is everywhere. NVIDIA's StyleGAN papers report FID scores. Stable Diffusion benchmarks use FID. Every major generative model paper includes FID in their evaluation suite. If you're building or evaluating a generative image system — whether it's Swiggy generating food images for their AI menu, Myntra synthesizing fashion product photos, or a research lab training the next DALL-E — you'll be computing FID scores. Lower is better: a perfect FID of 0 means the generated and real distributions are identical.
Concept Snapshot
- What It Is
- A metric that compares the distribution of generated images to real images by measuring the Fréchet distance between two multivariate Gaussian distributions fitted to Inception-v3 features.
- Category
- Evaluation
- Complexity
- Intermediate
- Inputs / Outputs
- Inputs: a set of real images and a set of generated images (typically 10K-50K each). Output: a single FID score (lower is better, 0 = identical distributions).
- System Placement
- Used in the evaluation stage after training or fine-tuning generative models (GANs, VAEs, diffusion models) to assess image quality and distribution fidelity.
- Also Known As
- Fréchet Inception Distance, FID metric, Inception FID
- Typical Users
- ML researchers, generative AI engineers, computer vision engineers, model evaluation teams
- Prerequisites
- Pre-trained image classifiers (Inception-v3), Feature embeddings, Gaussian distributions, Distance metrics
- Key Terms
- Fréchet distanceInception-v3feature extractionmultivariate GaussianWasserstein-2 distancedistribution matchingsample size sensitivity
Why This Concept Exists
The Problem with Earlier Metrics
Before FID, the dominant metric for GAN evaluation was the Inception Score (IS). IS measures two things: (1) does each generated image look like it belongs to a clear category? and (2) does the model generate diverse images across categories?
But IS has a fatal flaw: it never looks at real images. A GAN could generate high-quality images of cats that look nothing like real cats, and IS wouldn't notice. Even worse, IS is biased toward ImageNet's 1000 classes — if your domain is medical images, fashion, or anything else, IS becomes unreliable.
The Need for Distribution Comparison
What we really want to know is: does the generative model's output distribution match the real data distribution? Not just "are individual images good?" but "does the entire generated set capture the statistics of reality?"
This matters because:
Diversity: A model might generate photorealistic faces but only produce young, light-skinned faces. FID would catch this distributional mismatch.
Mode collapse: A GAN might memorize and repeat 100 training images. FID would detect that the generated distribution is too narrow.
Artifacts: Systematic failures like checkerboard patterns or color shifts show up as distributional differences, even if individual images look okay to the human eye.
The Innovation of FID
Heusel et al. made two key insights:
First, use a powerful feature extractor (Inception-v3) to embed images into a semantic space where "closeness" corresponds to perceptual similarity.
Second, model the real and generated features as multivariate Gaussian distributions and compute the Fréchet distance (also called Wasserstein-2 distance) between them. This captures both the mean (central tendency) and covariance (diversity and correlations) of the distributions.
The result? A single number that reflects both quality and diversity, compared against real data. FID quickly replaced IS as the gold standard and remains dominant today.
Historical Note: The original FID paper came from the same research group at Johannes Kepler University Linz that pioneered many GAN training techniques. Their focus was stabilizing GAN training, and FID emerged as a byproduct — a reliable way to measure progress during training.
Core Intuition & Mental Model
The Core Idea: Compare Feature Distributions, Not Pixels
Here's the intuition. Imagine you have two bags of photos: one contains real photos of dogs, the other contains AI-generated dog images. How do you measure if the generated bag "looks like" the real bag?
You could compare pixel values, but that's too strict — a slightly shifted or color-adjusted image would register as completely different. Instead, you extract semantic features from both sets using a powerful pre-trained classifier (Inception-v3).
Think of these features as high-level descriptions: "has floppy ears," "furry texture," "outdoor background," encoded as a 2048-dimensional vector. Now you have two clouds of points in this 2048-dimensional space — one cloud for real images, one for generated images.
Fitting Gaussians
FID assumes each cloud follows a multivariate Gaussian distribution (a bell curve in high dimensions). For each cloud, you compute:
- The mean vector (the center of the cloud)
- The covariance matrix (how spread out the cloud is, and how dimensions correlate)
Measuring the Distance
The Fréchet distance between two Gaussians is a geometric measure that accounts for both:
- How far apart the centers are (the means)
- How differently the clouds are shaped (the covariances)
Intuitively, if the generated cloud has the same center and shape as the real cloud, the distributions are similar — and FID is low. If the centers are far apart, or one cloud is much wider/narrower than the other, FID is high.
Why This Works
By comparing distributions rather than individual images, FID is:
- Robust to small variations (translation, color jitter)
- Sensitive to systematic failures (mode collapse, artifacts)
- Perceptually meaningful (because Inception-v3 features encode semantic content)
Mental Model: FID is like comparing two cities' population distributions. You don't compare individual people — you compare the average age, income spread, and demographic correlations. If two cities have similar statistical profiles, they're "close" in FID terms, even if no individual resident matches perfectly.
Technical Foundations
Mathematical Definition
Let be the set of real images and be the set of generated images. We pass each set through a pre-trained Inception-v3 network and extract features from the final pooling layer (before the classification head), yielding 2048-dimensional feature vectors.
Let denote the mean and covariance of the real features, and denote the mean and covariance of the generated features.
The Fréchet Inception Distance is defined as:
where:
- is the squared Euclidean distance between the means
- denotes the matrix trace (sum of diagonal elements)
- is the matrix square root of the product of covariances
Interpretation
The first term measures how far apart the centers of the two distributions are. If the generated images have systematically different high-level features (e.g., always darker, missing certain object types), this term will be large.
The second term measures how differently shaped the distributions are. It captures:
- Variance mismatch (one distribution is more spread out)
- Correlation structure differences (features correlate differently)
Why Fréchet Distance?
The Fréchet distance is equivalent to the 2-Wasserstein distance between two Gaussian distributions. Wasserstein distances are well-behaved: they satisfy the triangle inequality, scale sensibly with distribution differences, and have nice theoretical properties.
Score Interpretation
- FID = 0: Generated and real distributions are identical (practically impossible)
- FID < 10: State-of-the-art generative models (e.g., StyleGAN3, Stable Diffusion v2)
- FID 10-50: Good quality, noticeable but minor distributional differences
- FID 50-150: Moderate quality, visible artifacts or low diversity
- FID > 150: Poor quality, significant distributional mismatch
Important: FID scores are not comparable across datasets. An FID of 20 on FFHQ faces doesn't mean the same thing as FID 20 on ImageNet. Always compare FID scores on the same evaluation set.
Internal Architecture
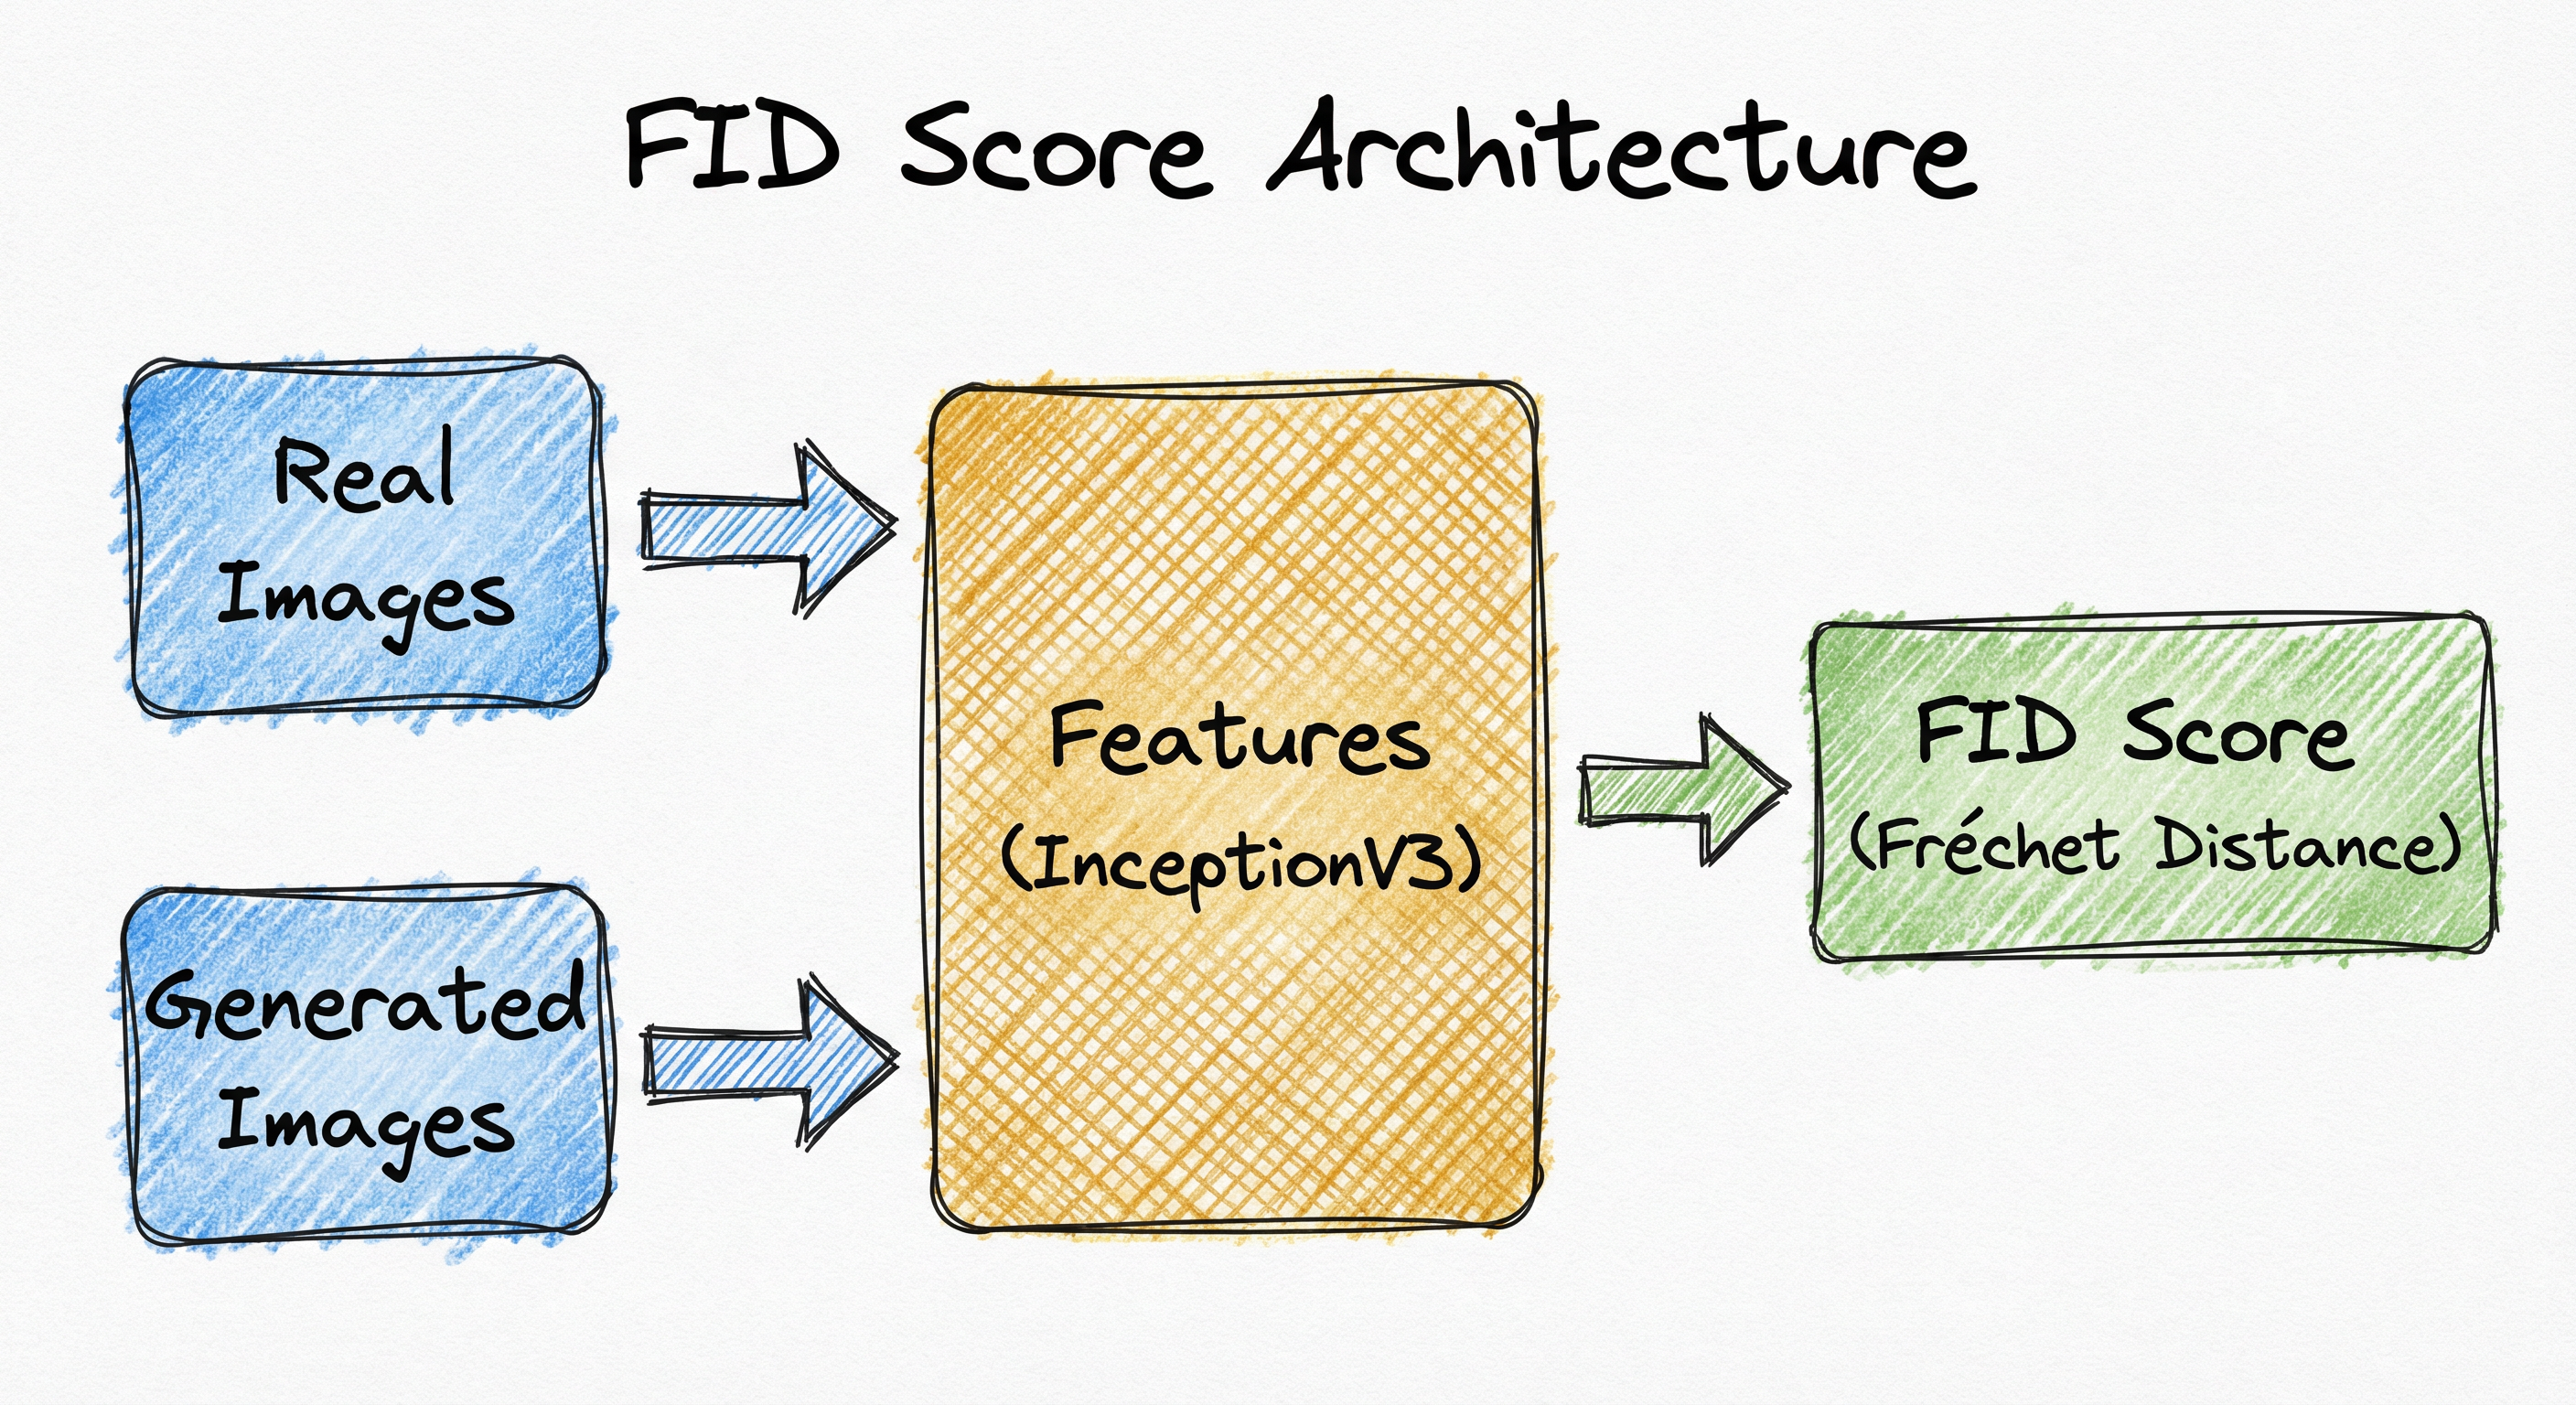
The FID calculation pipeline consists of three stages: feature extraction using a pre-trained Inception-v3 model, distribution parameter estimation (computing means and covariances), and Fréchet distance calculation. The architecture is stateless and deterministic — given the same inputs, it always produces the same FID score.
Key Components
Inception-v3 Feature Extractor
A pre-trained CNN (trained on ImageNet) that maps each image to a 2048-dimensional feature vector from the final pooling layer. This layer captures high-level semantic content while discarding low-level pixel details.
Batch Inference Engine
Efficiently processes thousands of images through Inception-v3 in batches, handling memory management and GPU utilization. Typical batch sizes are 32-128 images.
Statistics Estimator
Computes the sample mean μ and covariance matrix Σ from the extracted features. For N samples in d=2048 dimensions, this involves computing a 2048×2048 covariance matrix.
Fréchet Distance Calculator
Computes the matrix square root (the most expensive step) and evaluates the final FID formula. Uses numerical linear algebra (SVD or eigendecomposition).
Numerical Stabilization
Adds a small regularization term (e.g., ) to covariance matrices to avoid numerical issues with singular or near-singular matrices during square root computation.
Data Flow
Input Stage: Collect two sets of images (real and generated), typically 10,000-50,000 images each. Resize and preprocess images to 299×299 (Inception-v3 input size).
Feature Extraction: Pass each image through Inception-v3, extract the 2048-D feature vector from the final pooling layer. Store features in memory or on disk.
Statistics Computation: Calculate the mean vector (element-wise average) and covariance matrix (pairwise feature correlations) for both real and generated feature sets.
Distance Calculation: Compute the Fréchet distance using the formula. The matrix square root is computed via eigendecomposition or SVD, which is the computational bottleneck.
Output: A single scalar FID score, typically reported with 2-3 decimal places.
A pipeline where real and generated images converge into Inception-v3 feature extraction, split into separate statistics computation for each distribution, and finally merge into a single Fréchet distance calculation producing the FID score.
How to Implement
Implementation Landscape
There are three generations of FID implementations:
Generation 1: Original TensorFlow TTUR — The original implementation from Heusel et al., based on TensorFlow. Still used for reproducibility but slow and awkward to integrate.
Generation 2: pytorch-fid — The most widely adopted implementation. Fast, simple, PyTorch-based. BUT: uses bilinear resizing, which introduces slight inconsistencies compared to PIL bicubic (the "correct" method according to Inception-v3 preprocessing).
Generation 3: clean-fid — Published at CVPR 2022 by Parmar et al. Fixes the resizing inconsistency and provides reference statistics for common datasets. This is the current gold standard for reproducible FID calculation.
Choosing an Implementation
For research reproducibility, use clean-fid with its pre-computed reference statistics.
For production monitoring where you're tracking a single model's progress over time, any implementation is fine as long as you're consistent.
For quick prototyping, torch-fidelity provides a unified interface for FID, IS, and KID.
Cost Note: Computing FID for 50K images requires
15 minutes on an NVIDIA V100 GPU (₹150/hour on AWS). For continuous evaluation in production, caching feature embeddings (rather than recomputing from images) saves significant cost — embeddings are ~8 KB per image vs. raw images at ~100 KB-1 MB.
from cleanfid import fid
import torch

# Compute FID between two directories of images
fid_score = fid.compute_fid(
    fdir1='path/to/real_images',
    fdir2='path/to/generated_images',
    mode='clean',              # Use clean preprocessing (PIL bicubic)
    num_workers=4,
    batch_size=64,
    device=torch.device('cuda')
)
print(f"FID: {fid_score:.2f}")

# Compare against pre-computed reference statistics (e.g., FFHQ)
fid_score_ref = fid.compute_fid(
    fdir1='path/to/generated_images',
    fdir2=None,
    mode='clean',
    dataset_name='ffhq',       # Use FFHQ reference stats
    dataset_res=1024,
    dataset_split='train'
)
print(f"FID vs FFHQ: {fid_score_ref:.2f}")
Clean-FID fixes a critical bug in pytorch-fid: image resizing. The original Inception-v3 preprocessing uses PIL's bicubic interpolation, but many implementations use PyTorch's bilinear or OpenCV's methods. This discrepancy can inflate FID scores by 5-10 points. Clean-FID's 'clean' mode ensures pixel-perfect compatibility with the original Inception-v3 preprocessing pipeline.
from pytorch_fid import fid_score

# Compute FID between two image directories
fid_value = fid_score.calculate_fid_given_paths(
    paths=['path/to/real_images', 'path/to/generated_images'],
    batch_size=50,
    device='cuda',
    dims=2048,                 # Inception-v3 feature dimension
    num_workers=4
)
print(f"FID: {fid_value:.2f}")
PyTorch-FID is the most widely used implementation despite its resizing inconsistency. It's fast, well-maintained, and simple. For tracking model progress within a single project (where absolute FID values don't matter, only relative improvements), this is perfectly fine. But for cross-paper comparisons or reproducibility, prefer clean-fid.
import torch_fidelity

# Compute FID, IS, and KID in one call
metrics = torch_fidelity.calculate_metrics(
    input1='path/to/generated_images',
    input2='path/to/real_images',
    cuda=True,
    isc=True,      # Compute Inception Score
    fid=True,      # Compute FID
    kid=True,      # Compute Kernel Inception Distance
    verbose=True,
    batch_size=64
)

print(f"FID: {metrics['frechet_inception_distance']:.2f}")
print(f"IS: {metrics['inception_score_mean']:.2f} ± {metrics['inception_score_std']:.2f}")
print(f"KID: {metrics['kernel_inception_distance_mean']:.4f}")
Torch-fidelity provides a single interface for multiple generative model metrics. It's thoroughly tested against reference implementations and handles edge cases well (e.g., small sample sizes). Use this if you need multiple metrics or want a production-grade library with extensive validation tests.
import numpy as np
import torch
import torchvision.models as models
from scipy import linalg
from torch.nn.functional import adaptive_avg_pool2d

def get_inception_features(images, model, batch_size=32):
    """Extract Inception-v3 features from images."""
    model.eval()
    features = []
    with torch.no_grad():
        for i in range(0, len(images), batch_size):
            batch = images[i:i+batch_size].cuda()
            # Get features before final FC layer
            pred = model(batch)
            features.append(pred.cpu().numpy())
    return np.concatenate(features, axis=0)

def calculate_frechet_distance(mu1, sigma1, mu2, sigma2, eps=1e-6):
    """Compute Fréchet distance between two Gaussians."""
    mu1 = np.atleast_1d(mu1)
    mu2 = np.atleast_1d(mu2)
    sigma1 = np.atleast_2d(sigma1)
    sigma2 = np.atleast_2d(sigma2)

    diff = mu1 - mu2
    # Product might be almost singular
    covmean, _ = linalg.sqrtm(sigma1.dot(sigma2), disp=False)
    if not np.isfinite(covmean).all():
        offset = np.eye(sigma1.shape[0]) * eps
        covmean = linalg.sqrtm((sigma1 + offset).dot(sigma2 + offset))

    # Numerical error might give slight imaginary component
    if np.iscomplexobj(covmean):
        covmean = covmean.real

    tr_covmean = np.trace(covmean)
    return diff.dot(diff) + np.trace(sigma1) + np.trace(sigma2) - 2 * tr_covmean

# Load Inception-v3
inception = models.inception_v3(pretrained=True, transform_input=False)
inception.fc = torch.nn.Identity()  # Remove final FC layer
inception = inception.cuda()

# Extract features
feats_real = get_inception_features(real_images, inception)
feats_gen = get_inception_features(generated_images, inception)

# Compute statistics
mu_real, sigma_real = np.mean(feats_real, axis=0), np.cov(feats_real, rowvar=False)
mu_gen, sigma_gen = np.mean(feats_gen, axis=0), np.cov(feats_gen, rowvar=False)

# Compute FID
fid = calculate_frechet_distance(mu_real, sigma_real, mu_gen, sigma_gen)
print(f"FID: {fid:.2f}")
This is a stripped-down implementation showing the core FID calculation. In practice, you'd use a library, but understanding the internals is valuable for debugging. Key details: (1) we remove Inception's final classification layer to get 2048-D features, (2) we add eps to avoid singular matrices, (3) we discard imaginary components from numerical errors in the matrix square root.
# Example clean-fid configuration for production monitoring
# config.yaml
fid_evaluation:
  real_images_dir: /data/real_images
  generated_images_dir: /data/generated_images
  mode: clean                  # Use clean preprocessing
  batch_size: 64
  num_workers: 8
  device: cuda
  num_samples: 50000           # Number of images to use
  seed: 42                     # Fix random seed for reproducibility
  cache_features: true         # Cache Inception features to disk
  cache_dir: /data/fid_cache
Common Implementation Mistakes
- ●
Using different sample sizes for real vs. generated images — FID is sensitive to sample size. If you use 50K real images but only 5K generated images, the covariance estimate for generated images will be noisier, artificially inflating FID. Always use matched sample sizes, or at minimum ensure both are large enough (>10K).
- ●
Not fixing the random seed when evaluating the same model — If you sample different generated images each time you compute FID, you'll see variance in the score. For reproducibility, always use the same random seed when generating evaluation samples.
- ●
Comparing FID scores across different datasets — FID is dataset-dependent. An FID of 15 on FFHQ-1024 is not the same as FID 15 on ImageNet-256. Never compare absolute FID values across datasets — only compare relative changes on the same dataset.
- ●
Using the wrong image preprocessing — Inception-v3 expects images normalized to [-1, 1] and resized to 299×299 with bicubic interpolation. Using the wrong normalization (e.g., [0, 1] or ImageNet normalization) or wrong resizing method can inflate FID by 10+ points. Stick to clean-fid or torch-fidelity to avoid this.
- ●
Ignoring numerical instability in covariance matrix square root — When the covariance matrix is near-singular (e.g., with small sample sizes or low-diversity data), the matrix square root can produce NaN or inf. Always add a small epsilon (1e-6) to the diagonal for numerical stability.
When Should You Use This?
Use When
You are evaluating generative image models (GANs, VAEs, diffusion models) and need a distribution-level quality metric
You need to compare model versions or training checkpoints to identify which produces more realistic and diverse outputs
You want a metric that captures both image quality (realism) and diversity (coverage of the real distribution) in a single number
You are reproducing research results and need to report FID for comparison with published baselines (it's the industry standard)
You need to detect mode collapse or other distributional failures that might not be obvious from qualitative inspection
Your dataset is photorealistic images (natural images, faces, objects) where Inception-v3's ImageNet-pretrained features are meaningful
Avoid When
Your images are far outside Inception-v3's training distribution (e.g., medical X-rays, satellite imagery, abstract art) — FID may not correlate with perceptual quality in these domains. Consider domain-specific feature extractors instead.
You need pixel-level accuracy metrics (for super-resolution, inpainting, or image-to-image translation). Use PSNR/SSIM for reconstruction fidelity, not FID.
You have fewer than 2,000-5,000 images per distribution — FID's covariance estimates become unreliable with small samples. Consider using Kernel Inception Distance (KID) instead, which has lower sample size requirements.
You need interpretability or localized failure analysis (e.g., "which regions of the image are wrong?"). FID is a global metric that doesn't provide spatial or feature-level explanations.
Your evaluation budget is tight — computing FID for large datasets is GPU-intensive. A single FID calculation for 50K images takes
15 minutes on a V100 (₹150/hour). For rapid iteration, consider using a smaller sample (but be consistent).
Key Tradeoffs
The Fundamental Tradeoff: Sample Size vs. Statistical Reliability
FID requires estimating a 2048×2048 covariance matrix from sample data. With too few samples, this estimate is noisy, and FID scores become unreliable. The rule of thumb: use at least 10,000 samples per distribution for stable FID estimates. With 50,000 samples, you approach the reliability of published research.
But more samples = more compute. For a generative model producing 512×512 images, generating and evaluating 50K images might take hours. The practical compromise: use 10K-20K samples for development and 50K for final benchmarks.
The Second Axis: FID vs. Human Judgment
FID correlates well with human perceptual quality for natural images — faces, objects, scenes. But correlation is not perfect. Some failure modes FID misses:
- Small but critical errors: A six-fingered hand or text that's gibberish. FID might not penalize these heavily if the overall distribution is correct.
- Domain shift: A model that generates photorealistic images of a slightly wrong domain (e.g., indoor vs. outdoor scenes) might have good FID but poor task alignment.
The solution? Always complement FID with human evaluation for production deployments. FID is a guard rail, not a replacement for qualitative assessment.
FID vs. Other Metrics
FID vs. Inception Score (IS): FID compares to real data; IS does not. FID wins unless you literally have no access to real data.
FID vs. Precision/Recall: FID is a single number; precision-recall curves show quality vs. diversity tradeoffs explicitly. Use P/R for deeper analysis, FID for headline numbers.
FID vs. CLIP Score: FID measures distribution fidelity; CLIP measures text-image alignment. For text-to-image models, report both.
Expert Insight: FID is excellent for tracking training progress and comparing models. But when you're shipping a product to users — say, an AI image editor for Canva India or a virtual try-on for Myntra — you'll need human evaluations to catch edge cases that FID misses.
Alternatives & Comparisons
PSNR and SSIM measure pixel-level reconstruction quality for paired image comparisons (e.g., super-resolution, denoising). Use PSNR/SSIM when you have ground-truth images and need to measure pixel-wise fidelity. Use FID when evaluating unconditional or conditional generation where there's no single correct output — FID measures distribution-level realism, not pixel accuracy.
Inception Score (IS) uses a pre-trained image classifier to measure whether generated images are confidently classified and diverse across classes. Unlike FID, IS does not compare to real data — it only looks at generated images. FID is strictly better for most use cases, but IS can be useful when you lack a real-data reference set. In practice, report both: FID for distribution fidelity, IS for sanity-checking class diversity.
Pros, Cons & Tradeoffs
Advantages
Industry-standard metric with universal adoption — every major generative model paper reports FID, enabling direct comparison across StyleGAN, Stable Diffusion, DALL-E, and more. If you're publishing research or benchmarking models, FID is non-negotiable.
Captures both quality and diversity in a single score — unlike Inception Score (quality only) or precision-recall curves (two separate metrics). FID penalizes both blurry images (low quality) and mode collapse (low diversity) simultaneously.
Statistically grounded in the Fréchet distance between Gaussian distributions, with well-understood properties. You're not relying on an arbitrary heuristic — there's solid math backing the metric.
Relatively robust to hyperparameters compared to Inception Score — FID doesn't depend on temperature or arbitrary thresholds. As long as you use the same sample size and preprocessing, FID is reproducible.
Efficient computation via pre-trained Inception-v3 — no need to train a custom evaluator. A single V100 can compute FID for 50K images in ~15 minutes, making it practical for continuous integration testing in production.
Disadvantages
Biased toward ImageNet distribution because Inception-v3 was trained on ImageNet. For domains far from natural images (medical scans, satellite imagery, abstract art), FID may not correlate well with perceptual quality. You might need domain-specific feature extractors.
Requires large sample sizes (10K-50K images) for stable estimates — with fewer samples, FID variance increases and covariance estimates become unreliable. This is expensive for models with slow generation (e.g., diffusion models with 50-100 steps).
Doesn't detect localized or rare failures — a model might have 99.9% perfect images and 0.1% catastrophic failures (six fingers, garbled text), and FID might not penalize this heavily if the overall distribution is close.
Assumes Gaussian distributions — real and generated features might not follow multivariate Gaussians, especially for multi-modal or heavily skewed data. In practice, this assumption often holds "well enough," but it's still a simplification.
Sensitive to implementation details (image resizing, normalization) — different FID implementations can differ by 5-10 points due to preprocessing bugs. Always specify which implementation you used (pytorch-fid, clean-fid, torch-fidelity).
Failure Modes & Debugging
Sample Size Too Small
Cause
Estimating a 2048×2048 covariance matrix from fewer than 2,000-5,000 samples produces noisy estimates. The covariance matrix might become singular or near-singular, causing numerical instability in the matrix square root calculation.
Symptoms
FID scores vary wildly across runs with different random seeds. You might see NaN or inf values. FID might not correlate with visual quality. Covariance matrices fail to invert, causing crashes.
Mitigation
Use at least 10,000 samples per distribution for stable FID estimates (50,000 is ideal for research). If you must use fewer samples, switch to Kernel Inception Distance (KID), which is sample-efficient and doesn't require covariance estimation. Add numerical stabilization (epsilon term on diagonal) to avoid singular matrices.
Mismatched Preprocessing
Cause
Different FID implementations use different image resizing and normalization. The original Inception-v3 preprocessing uses PIL's bicubic interpolation, but pytorch-fid uses PyTorch's bilinear by default. This mismatch inflates FID scores by 5-10 points.
Symptoms
FID scores are higher than expected when comparing against published baselines. Scores differ significantly between pytorch-fid and clean-fid. Images that look visually identical produce different FID scores after resizing.
Mitigation
Use clean-fid with mode='clean' for reproducible, standards-compliant FID calculation. If you must use pytorch-fid, document this in your paper/report. For reproducibility, always report which implementation and version you used. When comparing to published work, match their preprocessing exactly.
Domain Mismatch with Inception-v3
Cause
Inception-v3 was trained on ImageNet (natural images: animals, objects, scenes). For images far outside this distribution — medical X-rays, satellite imagery, microscopy, abstract art — Inception features may not meaningfully capture perceptual quality.
Symptoms
FID scores don't correlate with human judgments. Models that humans rate as better have worse (higher) FID. FID improvements plateau while visual quality continues to improve.
Mitigation
For non-natural images, consider using a domain-specific feature extractor (e.g., a classifier pre-trained on medical images for medical domain). Alternatively, use perceptual metrics like LPIPS (Learned Perceptual Image Patch Similarity) that can be adapted to different domains. Report FID alongside human evaluations to validate correlation.
Comparing FID Across Datasets
Cause
FID is dataset-dependent — the distribution of real images defines the "target" for the generative model. An FID of 10 on FFHQ faces is not comparable to FID 10 on COCO objects or ImageNet.
Symptoms
Confusion when comparing models trained on different datasets. Claims like "our model achieves FID 15, better than model X's FID 20" when the datasets differ. Invalid cross-benchmark comparisons.
Mitigation
Never compare absolute FID values across datasets. Only compare FID scores on the same evaluation set. When reporting FID, always specify the dataset (e.g., "FID 12.3 on FFHQ-1024" or "FID 8.7 on ImageNet-256"). For cross-dataset comparisons, use human evaluations or task-specific metrics.
Placement in an ML System
FID sits in the evaluation stage after training or fine-tuning a generative model. During training, you might compute FID every N checkpoints (e.g., every 10K iterations) to track progress. For production deployment, FID is part of the model selection process — you evaluate multiple candidate models and choose the one with the best FID (and other metrics).
Upstream, FID receives images from a trained generative model. Downstream, FID scores feed into CI/CD decisions (e.g., only deploy if FID < threshold), model registry (store FID alongside each model version), or A/B testing frameworks (compare FID of model variants).
In production systems like Midjourney, Stable Diffusion, or DALL-E, FID is computed on held-out test sets to monitor model quality over time. For example, OpenAI might track FID on a curated benchmark as they iterate on DALL-E. If FID suddenly increases, it signals a regression that needs investigation.
Production Pattern: Cache Inception features for your test set once. For each new model checkpoint, compute features for generated images, then compute FID against the cached test features. This enables fast, continuous evaluation without re-processing the real dataset every time.
Pipeline Stage
Evaluation
Upstream
- model-training
- full-fine-tuning
- lora-fine-tuning
Downstream
- model-registry
- canary-deploy
- blue-green-deploy
Scaling Bottlenecks
The primary bottleneck is feature extraction through Inception-v3. For 50,000 images at 299×299 resolution, you're running ~50K forward passes through a 27-million-parameter CNN. On an NVIDIA V100, this takes ~15 minutes. On a CPU, it would take hours. The solution: batch inference on GPU with batch size 32-128, and feature caching — compute Inception features once for the real dataset, cache them to disk (~8 KB per image), and reuse them for all evaluations. This reduces FID computation from 15 minutes to ~30 seconds (statistics computation only).
Production Case Studies
NVIDIA's StyleGAN (2018) introduced a style-based generator architecture that achieved state-of-the-art FID scores on FFHQ (Flickr-Faces-HQ) dataset. StyleGAN achieved FID 4.4 on FFHQ-1024, a massive improvement over prior GANs. The paper used FID as the primary metric to validate architectural choices like adaptive instance normalization (AdaIN) and progressive growing. FID guided ablation studies — they could quantitatively measure how each component (style mixing, truncation trick, etc.) affected generation quality.
StyleGAN became the foundation for numerous applications: AI-generated portraits (thispersondoesnotexist.com), face editing tools, and virtual avatar generation. FID's quantitative validation enabled rapid iteration and confident deployment.
Stable Diffusion uses FID to evaluate text-to-image generation quality on datasets like MS-COCO and LAION. The original Latent Diffusion Models paper (which Stable Diffusion builds on) reported FID 12.6 on ImageNet-256 and FID 7.7 on CelebA-HQ-256. During model development, the team used FID to compare different latent space configurations, diffusion schedules, and conditioning mechanisms. FID helped them balance quality vs. inference speed — higher diffusion steps improved FID but increased latency.
Stable Diffusion achieved widespread adoption (10+ million users within months of release), partly due to quantitatively validated quality. FID provided objective evidence that the model was competitive with DALL-E 2 and Midjourney.
OpenAI's DALL-E 2 (2022) used FID alongside CLIP score to evaluate text-to-image generation. The paper reported FID 10.39 on MS-COCO (zero-shot, no fine-tuning on COCO). FID was critical for comparing DALL-E 2 against baselines like GLIDE and comparing different architecture variants (diffusion decoder design, CLIP guidance strength). FID also detected mode collapse during early experiments — certain prompts produced very similar outputs, which FID caught before human evaluators noticed.
FID enabled data-driven iteration and gave confidence that DALL-E 2 matched or exceeded prior art. The metric justified deployment to 1 million+ beta users.
Researchers at UC Berkeley published "Rethinking FID" (CVPR 2024), analyzing FID's limitations and proposing CMMD (CLIP Maximum Mean Discrepancy) as a complementary metric. They showed that FID has statistical bias depending on sample size — even with 50K samples, FID can rank models inconsistently. They also demonstrated that FID struggles with diffusion models in late training (unexpected behavior when quality improves). This work highlighted the need for multiple metrics, not just FID.
The paper influenced the community to adopt more robust evaluation — reporting FID + CLIP score + precision-recall curves. It also validated clean-fid's importance for reproducibility.
Tooling & Ecosystem
The current gold standard for FID calculation. Fixes image resizing inconsistencies in pytorch-fid (uses PIL bicubic, matching Inception-v3 preprocessing). Provides pre-computed reference statistics for FFHQ, ImageNet, COCO, CelebA-HQ, and more. Published at CVPR 2022. Supports both 'legacy' mode (pytorch-fid compatible) and 'clean' mode (correct preprocessing). Strongly recommended for reproducible research.
The most widely adopted FID implementation. Fast, simple, well-documented. Caveat: uses PyTorch bilinear resizing by default, which inflates FID by ~5-10 points compared to PIL bicubic. Still excellent for tracking relative progress within a project, but prefer clean-fid for cross-paper comparisons. Over 2,000 GitHub stars and widely cited.
High-fidelity metrics library supporting FID, Inception Score (IS), and Kernel Inception Distance (KID). Extensively validated against reference implementations (TensorFlow TTUR). Provides unified API for multiple metrics. Handles edge cases well (small batches, caching). Great for production systems that need multiple metrics with a single interface. Includes comprehensive numerical precision tests.
FID metric integrated into PyTorch Ignite's metrics API. Designed for training-time evaluation — compute FID on-the-fly during model training without stopping the training loop. Supports distributed training (multi-GPU). Convenient if you're already using Ignite for training. Uses pytorch-fid backend.
FID implementation in the TorchMetrics library (from PyTorch Lightning). Integrates seamlessly with Lightning training loops. Supports distributed evaluation and metric state synchronization across GPUs. Great for production ML platforms built on PyTorch Lightning. Provides streaming updates (add batches incrementally, compute FID at the end).
Research & References
Heusel, M., Ramsauer, H., Unterthiner, T., Nessler, B., & Hochreiter, S. (2017)NeurIPS 2017
The original FID paper. Proposes FID as an improvement over Inception Score by comparing generated and real distributions via Fréchet distance. Demonstrates that FID correlates better with human judgment and detects mode collapse more reliably than IS. This paper established FID as the gold standard for GAN evaluation.
Parmar, G., Zhang, R., & Zhu, J.-Y. (2022)CVPR 2022
Introduces clean-fid and analyzes FID's sensitivity to image preprocessing. Shows that different resizing methods (PIL bicubic vs. PyTorch bilinear) can change FID by 5-10 points. Provides reference statistics for common datasets with correct preprocessing. Essential reading for anyone computing FID — this paper fixed a critical reproducibility issue.
Jayasumana, S., Ramalingam, S., Veit, A., Glasner, D., Chakrabarti, A., & Kumar, S. (2024)CVPR 2024
Critical analysis of FID's limitations: statistical bias from finite samples, sensitivity to dataset size, and poor behavior on diffusion models. Proposes CMMD (CLIP Maximum Mean Discrepancy) as a complementary metric. Demonstrates that FID can rank models inconsistently depending on sample size. Recommends reporting multiple metrics (FID + CMMD + precision-recall).
Chong, M. J., & Forsyth, D. (2020)CVPR 2020
Analyzes statistical bias in FID and IS estimates. Shows that FID computed from finite samples is biased and that bias depends on the model being evaluated. Proposes effectively unbiased estimators that correct for sample size effects. Important for understanding FID's statistical properties and when to trust FID comparisons.
Borji, A. (2022)Computer Vision and Image Understanding 2022
Comprehensive survey of GAN evaluation metrics including FID, IS, KID, precision-recall, and perceptual path length. Compares metrics' strengths, weaknesses, and failure modes. Discusses when to use each metric. Essential reference for choosing the right evaluation strategy for your generative model.
Interview & Evaluation Perspective
Common Interview Questions
- ●
What is FID and why is it better than Inception Score?
- ●
How would you compute FID for a production generative model?
- ●
What are FID's limitations, and when would you use alternative metrics?
- ●
How does sample size affect FID, and what's the minimum you'd recommend?
- ●
Why does image preprocessing matter for FID calculation?
- ●
How would you debug a situation where FID is high but images look good to humans?
Key Points to Mention
- ●
FID measures distribution-level similarity between generated and real images, not individual image quality
- ●
Uses Inception-v3 features to embed images in a semantic space, then computes Fréchet distance between Gaussian-fitted distributions
- ●
Lower is better — FID of 0 means identical distributions; FID < 10 is state-of-the-art
- ●
FID is dataset-dependent — never compare FID scores across different datasets
- ●
Requires large sample sizes (10K-50K images) for stable estimates; small samples inflate variance
- ●
Preprocessing matters — use clean-fid for reproducibility; pytorch-fid has resizing inconsistencies
- ●
FID is biased toward ImageNet domain — may not correlate with quality for non-natural images (medical, satellite)
- ●
Complement FID with human evaluations — FID misses localized failures (six fingers, garbled text)
Pitfalls to Avoid
- ●
Claiming FID is "the perfect metric" — it's widely adopted but has limitations (sample size sensitivity, ImageNet bias, Gaussian assumption)
- ●
Not mentioning clean-fid vs. pytorch-fid — shows you don't understand the reproducibility crisis in FID calculation
- ●
Ignoring sample size — stating you'd compute FID on 1,000 images is a red flag
- ●
Confusing FID with pixel-level metrics like PSNR — FID measures distribution fidelity, not reconstruction accuracy
- ●
Not discussing alternatives like KID (better for small samples), CLIP score (for text-to-image), or precision-recall (for quality-diversity tradeoffs)
Senior-Level Expectation
Senior candidates should discuss production FID pipelines: feature caching to avoid recomputing Inception features, batching strategies for GPU efficiency, and CI/CD integration (e.g., automated FID checks on every model checkpoint). Discuss cost-performance tradeoffs: how many samples to use for dev vs. final evaluation, whether to use compressed image formats, and GPU vs. CPU compute budgets. Mention recent research: clean-fid (CVPR 2022), rethinking FID (CVPR 2024), and CMMD as a complementary metric. For ML platform roles, discuss how to build a reusable FID service that other teams can query via API — handling dataset uploads, feature caching, and metric versioning. Be ready to discuss domain-specific adaptations — when Inception-v3 is inappropriate and how to choose alternative feature extractors.
Summary
The Fréchet Inception Distance (FID) is the industry-standard metric for evaluating generative image models. By comparing the distribution of generated images to real images via Fréchet distance between Gaussian-fitted Inception-v3 features, FID captures both quality (realism) and diversity (coverage of the real distribution) in a single number. Lower FID scores indicate better generative models, with state-of-the-art systems achieving FID < 10 on challenging datasets like FFHQ and ImageNet.
FID revolutionized generative model evaluation when it was introduced in 2017, replacing the Inception Score as the gold standard. Unlike IS, which only evaluates generated images without comparing to real data, FID directly measures distributional fidelity. This makes FID essential for detecting mode collapse, artifacts, and diversity failures that individual image quality metrics miss.
In practice, FID is everywhere: NVIDIA's StyleGAN, Stable Diffusion, DALL-E 2, and every major GAN or diffusion model paper report FID scores. It's used in production systems for model selection, CI/CD gating, and continuous quality monitoring. For example, a team at Swiggy generating food images might compute FID every 10K training steps, cache Inception features for their test set, and only deploy models with FID below a threshold.
But FID is not perfect. It requires large sample sizes (10K-50K images) for stable estimates, is biased toward ImageNet's natural image distribution, and assumes Gaussian distributions. For non-natural images (medical scans, satellite imagery), FID may not correlate with perceptual quality. It also misses localized failures — a model with 99% perfect images and 1% catastrophic errors (six fingers, garbled text) might still have good FID.
The solution? Use FID as part of a multi-metric evaluation suite. Combine FID with human evaluations, precision-recall curves, and domain-specific metrics (CLIP score for text-to-image, LPIPS for perceptual quality). For reproducibility, use clean-fid (not pytorch-fid), which fixes image preprocessing inconsistencies that can inflate FID by 5-10 points.
For ML engineers building generative systems, understanding FID is non-negotiable. Know how to compute it efficiently (batch inference, feature caching), interpret it correctly (dataset-dependent, sample-size-sensitive), and complement it with qualitative analysis. FID is a powerful tool, but like any metric, it's a means to an end — shipping generative models that users love.