PSNR / SSIM in Machine Learning
PSNR (Peak Signal-to-Noise Ratio) and SSIM (Structural Similarity Index Measure) are the two most widely used full-reference image quality metrics in computer vision and signal processing. If you have ever trained a super-resolution model, built an image denoising pipeline, or evaluated a video codec, you have almost certainly computed PSNR and SSIM.
PSNR, rooted in the mean squared error (MSE), expresses image fidelity in decibels (dB) -- higher is better. SSIM, introduced by Zhou Wang et al. in their landmark 2004 paper, goes beyond pixel-level error by comparing luminance, contrast, and structural information between a reference and a distorted image, producing a score in the range [0, 1] -- where 1 means perfect structural similarity.
Despite being over two decades old, these metrics remain ubiquitous. Every major super-resolution paper (ESRGAN, Real-ESRGAN, SwinIR, HAT) reports PSNR/SSIM on benchmark datasets like Set5, Set14, BSD100, Urban100, and Manga109. Every image compression standard (JPEG, HEVC, AV1) is benchmarked using PSNR. Every denoising algorithm from BM3D to DnCNN to Restormer reports both metrics side by side.
But here is the critical caveat: PSNR and SSIM do not always correlate with human perception. A blurry image can score higher PSNR than a sharp, perceptually superior image. This tension -- between mathematical convenience and perceptual relevance -- is the central story of these metrics. Understanding when to trust them, when to complement them with perceptual metrics like LPIPS or MS-SSIM, and how to avoid their failure modes is essential for anyone building production vision systems.
Concept Snapshot
- What It Is
- PSNR measures the ratio of peak signal power to noise power (in dB) between a reference and distorted image based on MSE, while SSIM compares luminance, contrast, and structural information to produce a perceptual similarity score in [0, 1].
- Category
- Evaluation
- Complexity
- Beginner
- Inputs / Outputs
- Inputs: a reference (ground truth) image and a distorted/reconstructed image, both of the same dimensions. Outputs: PSNR in decibels (higher is better, typically 20-50 dB) and SSIM score from 0 to 1 (higher is better).
- System Placement
- Used in the evaluation stage after image reconstruction, super-resolution, denoising, compression, or generation tasks to assess output quality against a known reference image.
- Also Known As
- Peak Signal-to-Noise Ratio, Structural Similarity Index, SSIM Index, PSNR metric, image fidelity metrics
- Typical Users
- Computer vision engineers, Image processing researchers, Video codec engineers, ML engineers (super-resolution, denoising), Quality assurance teams
- Prerequisites
- Mean Squared Error (MSE), Logarithmic scales (decibels), Basic statistics (mean, variance, covariance), Image representation (pixel values, channels)
- Key Terms
- MSEPeak signal valuedecibels (dB)luminance comparisoncontrast comparisonstructure comparisonfull-reference metricMS-SSIMLPIPS
Why This Concept Exists
The Problem: How Do You Measure Image Quality Objectively?
Imagine you have built a super-resolution model that upscales a 256x256 image to 1024x1024. How do you know if the output is good? You could look at it -- but human evaluation is expensive, slow, and non-reproducible. You need an automated, objective metric that you can compute in milliseconds, track across training epochs, and use to compare models in a paper.
The simplest approach is pixel-level comparison: compute the difference between corresponding pixels in the reference and reconstructed images. This is MSE (Mean Squared Error) -- the average of the squared pixel differences. MSE is easy to compute, differentiable, and mathematically tractable. But it has a problem: an MSE of 100 means very different things depending on whether the pixel values range from 0-255 (8-bit) or 0-65535 (16-bit).
Enter PSNR: Normalizing MSE to a Human-Interpretable Scale
PSNR solves the dynamic range problem by normalizing MSE against the maximum possible signal value (e.g., 255 for 8-bit images) and converting to a logarithmic scale (decibels). This gives a scale-independent, interpretable number: PSNR of 30 dB means the signal is 1000x stronger than the noise; 40 dB means 10000x stronger.
PSNR became the de facto standard for image and video quality assessment in the 1990s and 2000s, adopted by the telecommunications and compression communities. The ITU, MPEG, and JPEG standards all use PSNR as a primary evaluation metric.
The Limitation of PSNR: Pixels Are Not Perception
But PSNR has a fundamental flaw: it treats all pixel errors equally, regardless of their perceptual impact. A slight global brightness shift (barely noticeable to humans) can produce the same MSE as structured noise that destroys image content. Zhou Wang and colleagues demonstrated this convincingly -- different distortions with identical MSE values produce vastly different subjective quality ratings.
SSIM: Modeling How Humans See
In 2004, Zhou Wang, Alan Bovik, Hamid Sheikh, and Eero Simoncelli published their landmark paper "Image Quality Assessment: From Error Visibility to Structural Similarity" in IEEE Transactions on Image Processing. The key insight was that the human visual system (HVS) is adapted to extract structural information from visual scenes, not to detect absolute pixel differences.
SSIM decomposes image quality into three independent components:
- Luminance -- the average brightness
- Contrast -- the dynamic range of brightness
- Structure -- the pattern of pixel correlations after normalizing for luminance and contrast
By comparing these three components between reference and distorted images, SSIM produces a quality score that correlates much better with human perception than PSNR/MSE.
The paper has been cited over 60,000 times -- one of the most cited papers in all of engineering -- and won the IEEE Signal Processing Society Best Paper Award. SSIM fundamentally changed how we think about image quality.
Historical Note: The idea that error metrics should model human perception, not just pixel differences, dates back to the 1970s. But it was Wang et al.'s elegant decomposition into luminance, contrast, and structure -- combined with a simple, fast formula -- that finally made perceptual metrics practical for everyday use.
Core Intuition & Mental Model
PSNR: How Much Noise Is Drowning Your Signal?
Think of PSNR like the signal-to-noise ratio in audio. When you listen to music in a quiet room, you hear every detail (high SNR). In a noisy train station, the music is drowned out (low SNR). PSNR measures the same thing for images: how much of the original image "signal" survives after reconstruction or compression.
The decibel scale is logarithmic, so each 10 dB increase means the signal is 10x stronger relative to the noise. In practice:
- PSNR < 25 dB: Visible distortion, typically unacceptable quality
- PSNR 25-30 dB: Noticeable artifacts, but often "good enough" for some applications
- PSNR 30-40 dB: Good to excellent quality; most distortions are subtle
- PSNR > 40 dB: Near-perfect reconstruction; differences barely visible
SSIM: Comparing Structure, Not Just Pixels
SSIM takes a different approach. Instead of asking "how different are the pixel values?", it asks three questions:
-
Are the images equally bright? (Luminance comparison) -- Our eyes adapt to average brightness, so a global brightness shift is less disturbing than local brightness errors.
-
Do they have the same contrast? (Contrast comparison) -- We perceive images through their dynamic range. Two images can have the same mean brightness but very different contrast.
-
Do they have the same patterns? (Structure comparison) -- After normalizing for brightness and contrast, do the images share the same texture, edges, and spatial patterns? This is what makes SSIM special -- it captures the "skeleton" of the image.
SSIM computes these three comparisons locally (in small patches, typically 11x11) and averages across the entire image. The result is a single number from 0 to 1, where 1 means the images are structurally identical.
Why SSIM Beats PSNR for Perception
Consider two distortions applied to the same image:
- Distortion A: Add a constant brightness offset of +20 to every pixel
- Distortion B: Add random salt-and-pepper noise with the same total MSE
Both have identical PSNR. But Distortion A looks nearly the same as the original (just slightly brighter), while Distortion B looks terrible (random black and white dots everywhere). SSIM correctly assigns a high score to A and a low score to B, because A preserves the structure while B destroys it.
Mental Model: PSNR is like weighing two bags of apples by total weight -- it tells you the overall difference but not whether you have the same variety of apples. SSIM is like comparing the arrangement, sizes, and types of apples -- it captures what makes the bags structurally similar.
Technical Foundations
PSNR: Mathematical Definition
Given a reference image and a distorted image , both of size pixels, the Mean Squared Error (MSE) is:
The Peak Signal-to-Noise Ratio (PSNR) is then defined as:
where is the maximum possible pixel value (e.g., 255 for 8-bit images, 1.0 for floating-point images).
Properties of PSNR:
- Unit: decibels (dB)
- Range: ; when MSE = 0, PSNR is undefined (often reported as dB)
- Higher is better
- Not bounded above -- theoretically infinite for identical images
SSIM: Mathematical Definition
SSIM is computed between two image patches and of the same size. Let:
- = mean intensities of and
- = variances of and
- = covariance of and
The three SSIM components are:
Luminance comparison:
Contrast comparison:
Structure comparison:
The SSIM index combines these three:
With the standard simplification , this reduces to:
where:
- with and (dynamic range)
- with
- are stabilization constants to avoid division by zero
Properties of SSIM:
- Range: in theory, but typically for non-negative images
- 1 = perfect structural similarity
- Symmetric:
- Computed on local patches (default: 11x11 Gaussian-weighted window), then averaged across the image
MS-SSIM: Multi-Scale Extension
MS-SSIM (Wang, Simoncelli, Bovik, 2003) extends SSIM by evaluating structural similarity at multiple spatial scales:
where is the number of scales (default 5), and are learned weights from psychophysical experiments. The image is iteratively downsampled by factor 2, and SSIM components are extracted at each scale. MS-SSIM accounts for the fact that human perception operates across multiple resolutions.
Implementation Detail: The stabilization constants and are critical. Without them, SSIM is undefined for constant-intensity patches (where variance is zero). The default values (, ) are well-validated across decades of research and should not be changed without good reason.
Internal Architecture
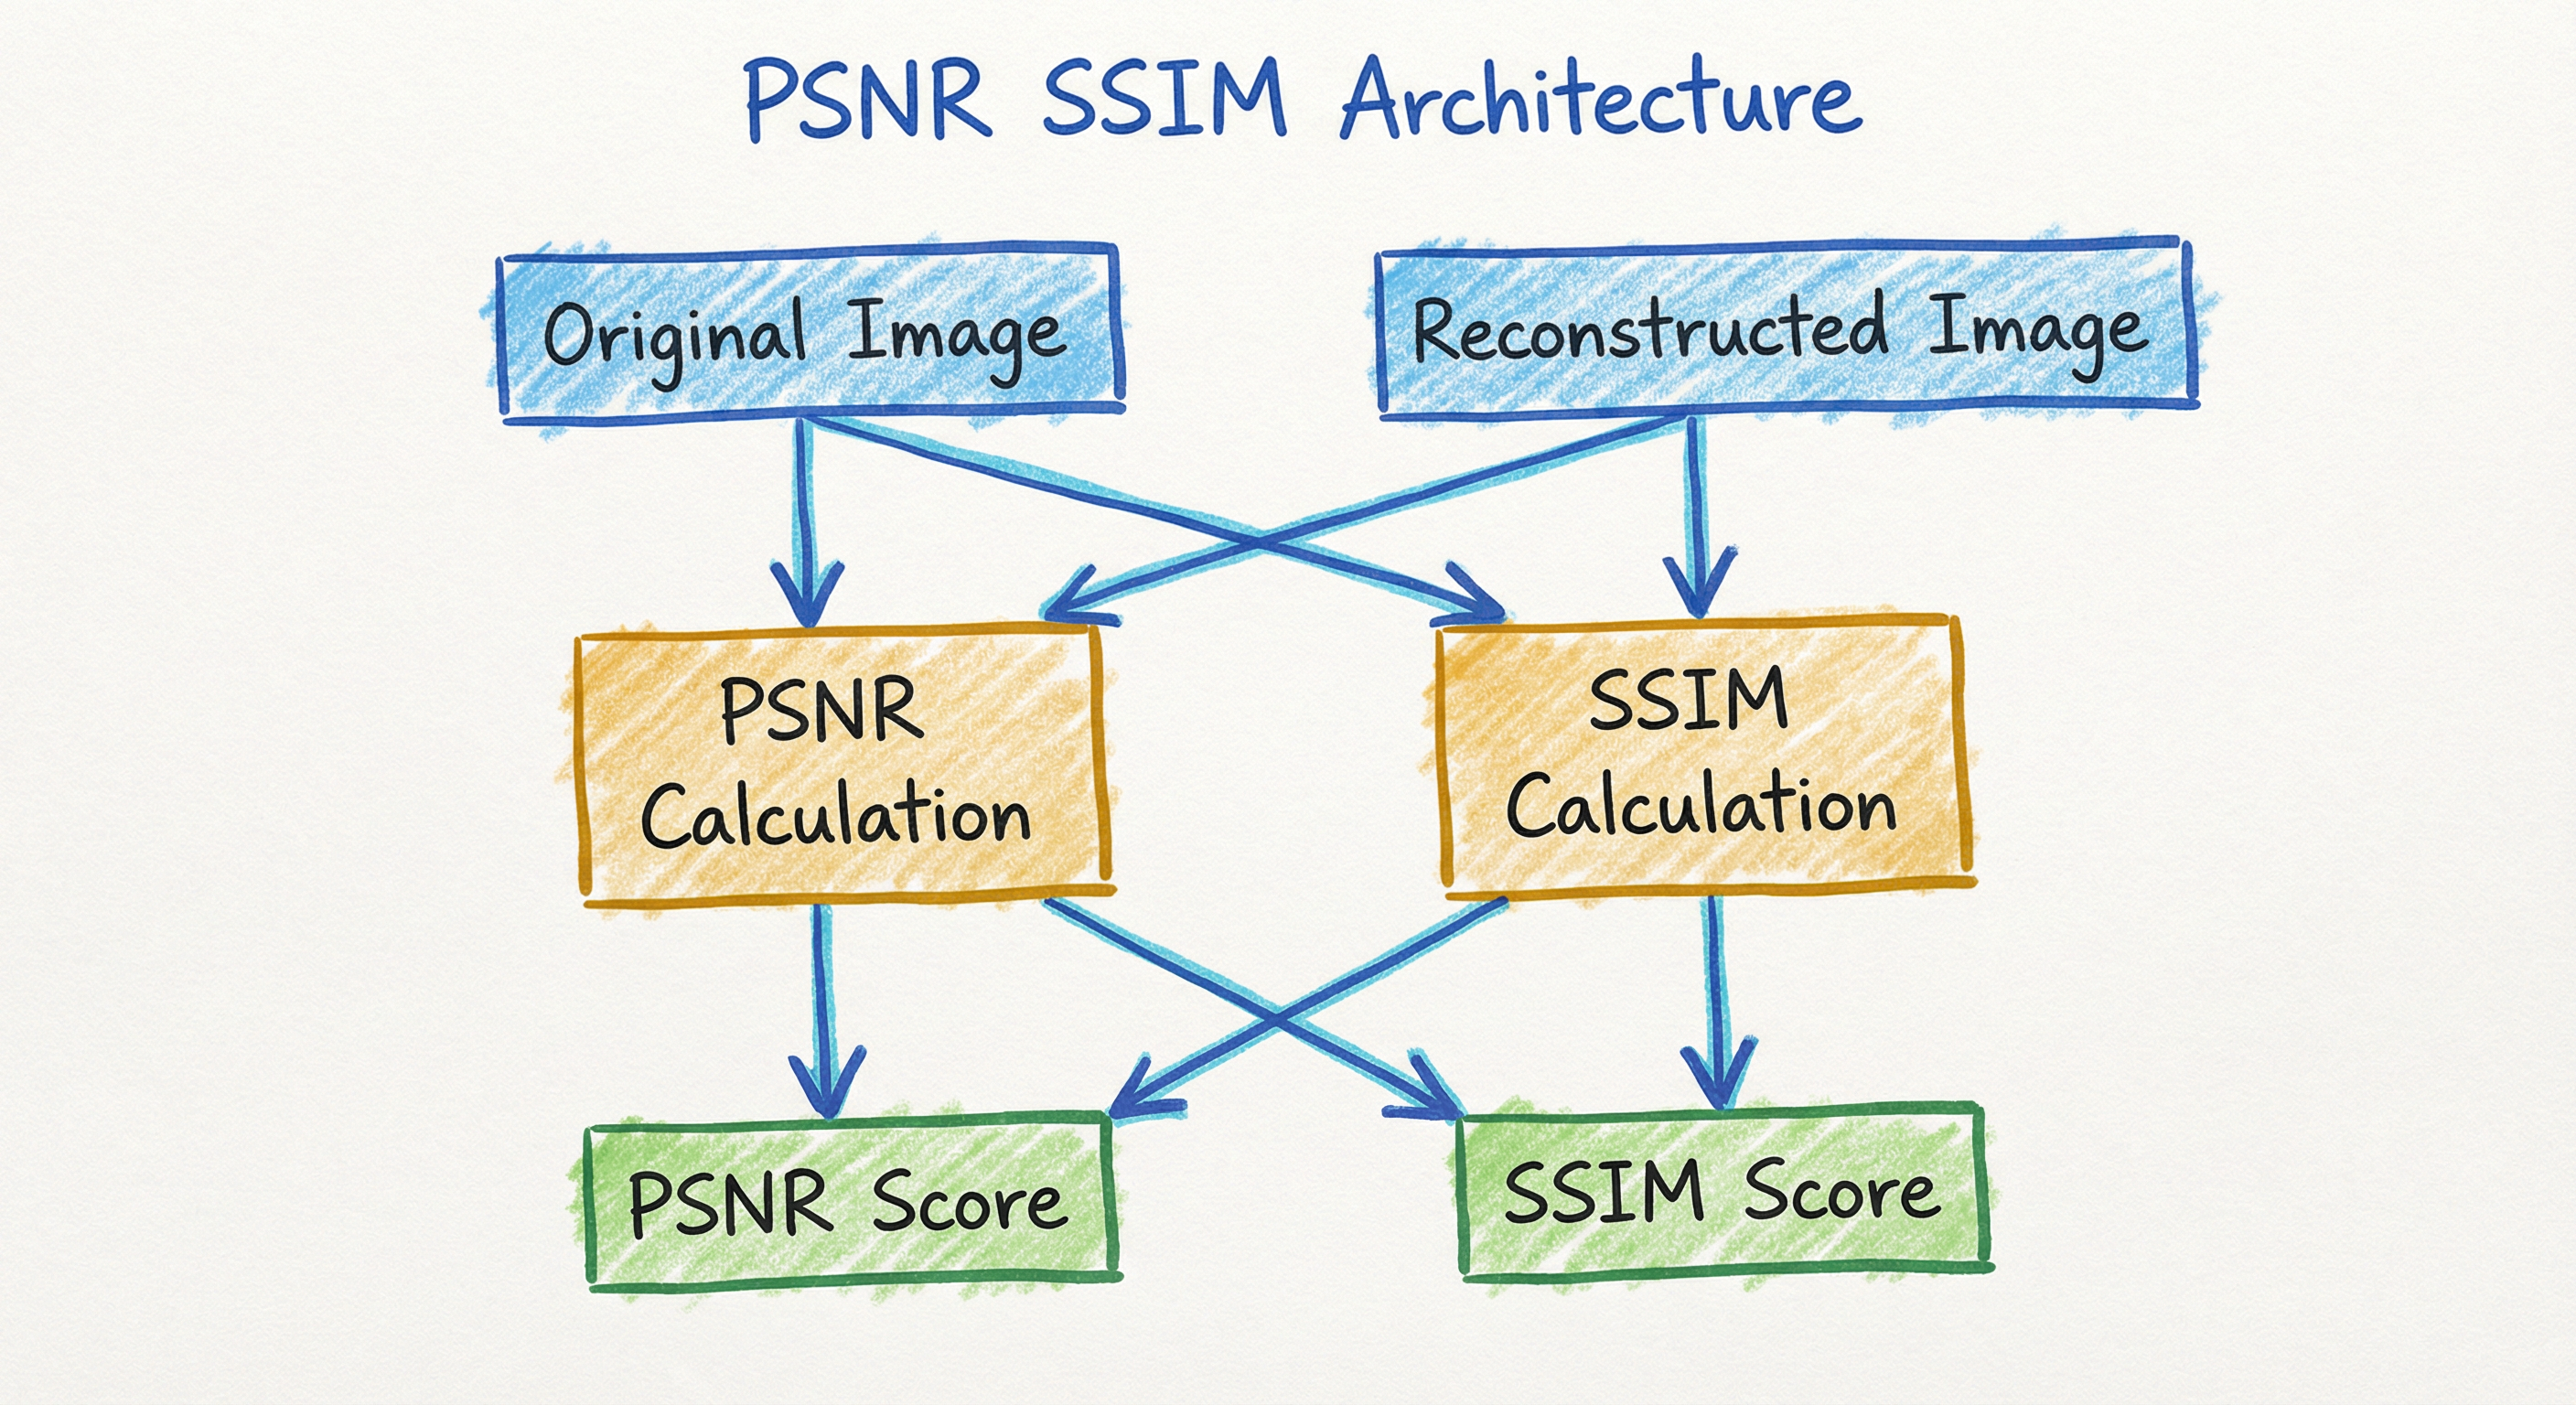
PSNR and SSIM are stateless, deterministic functions -- no training, no parameters to learn, no model weights. However, in production ML systems they appear within larger evaluation pipelines that manage batching, multi-scale computation, and integration with experiment tracking. The architecture below shows a typical evaluation pipeline for an image reconstruction model.
Key Components
Image Preprocessor
Ensures both reference and distorted images share the same dimensions, data type, and value range. Handles common mismatches: uint8 vs. float32, RGB vs. grayscale, and border cropping for super-resolution (where output edges may have artifacts from padding).
MSE Calculator (PSNR)
Computes the element-wise squared difference between reference and distorted images, then averages across all pixels and channels. For multi-channel images (RGB), MSE can be computed per-channel or across all channels jointly.
Decibel Converter (PSNR)
Converts MSE to the logarithmic PSNR scale using . Handles the MSE=0 edge case (identical images) by returning infinity or a large sentinel value.
Gaussian Window Generator (SSIM)
Creates an 11x11 Gaussian-weighted window () used for local statistics computation. The Gaussian weighting gives more importance to the center of each patch, mimicking foveal vision. This window is applied as a convolution filter.
Local Statistics Engine (SSIM)
Computes local means (, ), variances (, ), and covariance () for each patch using the Gaussian window. Implemented as a series of convolution operations for GPU efficiency.
SSIM Map Generator
Applies the SSIM formula at each pixel position to produce a spatial SSIM map showing per-pixel structural similarity. This map reveals which image regions are well-reconstructed and which have degraded quality.
Multi-Scale Pyramid (MS-SSIM)
Iteratively downsamples the image by factor 2 (using low-pass filtering) to create a Gaussian pyramid. SSIM components (luminance, contrast, structure) are computed at each scale and combined using learned weights.
Data Flow
Input Stage: Receive a reference image and a distorted/reconstructed image. Validate that dimensions match. Optionally crop borders (common in super-resolution where the model cannot reconstruct edge pixels accurately -- standard practice is to crop 4 pixels from each border for 4x upscaling).
PSNR Path: Compute per-pixel squared differences, average to get MSE, apply the log-scale formula to get PSNR in dB. This is a single global computation over the entire image.
SSIM Path: Generate the Gaussian window. Slide it across the image (as a convolution) to compute local means, variances, and covariance at every position. Apply the SSIM formula at each position to get a spatial SSIM map. Average the map to get the final SSIM score.
MS-SSIM Path: Build a Gaussian pyramid (5 scales by default). At each scale, compute contrast and structure SSIM components. At the coarsest scale, also compute luminance. Combine across scales using learned exponent weights.
Output Stage: Log PSNR (dB), SSIM (0-1), and optionally MS-SSIM (0-1) to experiment tracker (MLflow, W&B, TensorBoard). Optionally save the SSIM map as a heatmap for visual debugging.
A pipeline where reference and reconstructed images enter a preprocessing step, then branch into three parallel metric computation paths: PSNR (via MSE and dB conversion), SSIM (via patch-wise computation and spatial averaging), and MS-SSIM (via multi-scale aggregation). All three scores converge into a metric logger for tracking.
How to Implement
Two Contexts for Implementation
Context 1: Evaluation -- After training, compute PSNR/SSIM on a held-out test set to report model quality. This is the most common use case and prioritizes correctness and reproducibility.
Context 2: Training Loss -- Use SSIM (or MS-SSIM) as a loss function during training. SSIM is differentiable, so you can backpropagate through it. Many super-resolution and image restoration models use or as a loss component alongside L1 or perceptual loss.
Key Implementation Decisions
Color space: PSNR is typically computed on the Y channel of YCbCr (luminance only), following the tradition from video compression. SSIM can be computed per-channel (RGB) and averaged, or on the Y channel. Always match the convention of the benchmark you are comparing against.
Border cropping: For super-resolution, the standard practice is to crop scale_factor pixels from each border before computing metrics, because boundary artifacts from convolution padding are not representative of model quality.
Data range: Ensure your pixel values match the data_range parameter (255 for uint8, 1.0 for float32). A mismatch will silently produce incorrect PSNR/SSIM values.
Cost Note: PSNR is essentially free -- it is a single MSE computation. SSIM is slightly more expensive due to the sliding window convolution but still runs in milliseconds on GPU. For a 1080p image on an NVIDIA V100, PSNR takes ~0.1 ms and SSIM takes
2 ms. For a production pipeline processing 10,000 images, total evaluation time is under 30 seconds (₹5 on AWS GPU instances).
import numpy as np
from skimage.metrics import peak_signal_noise_ratio, structural_similarity
from skimage.io import imread

# Load reference and reconstructed images
ref_img = imread('reference.png')        # Shape: (H, W, 3), uint8
rec_img = imread('reconstructed.png')    # Shape: (H, W, 3), uint8

# Compute PSNR (higher is better)
psnr = peak_signal_noise_ratio(ref_img, rec_img, data_range=255)
print(f"PSNR: {psnr:.2f} dB")

# Compute SSIM (higher is better, range [0, 1])
# channel_axis=-1 for multi-channel (RGB) images
ssim = structural_similarity(
    ref_img, rec_img,
    data_range=255,
    channel_axis=-1,       # Compute SSIM per channel, then average
    win_size=11,           # Default 11x11 Gaussian window
    gaussian_weights=True  # Use Gaussian weighting (recommended)
)
print(f"SSIM: {ssim:.4f}")

# Get the spatial SSIM map for debugging
ssim_score, ssim_map = structural_similarity(
    ref_img[:, :, 0], rec_img[:, :, 0],  # Single channel for map
    data_range=255,
    full=True  # Return the SSIM map
)
print(f"SSIM map shape: {ssim_map.shape}")
print(f"Min SSIM region: {ssim_map.min():.4f}")
print(f"Max SSIM region: {ssim_map.max():.4f}")
scikit-image provides the reference implementation of PSNR and SSIM for evaluation. The data_range parameter must match your image's dynamic range (255 for uint8, 1.0 for float). The channel_axis parameter tells SSIM which axis contains color channels. Setting full=True returns a spatial SSIM map that shows per-pixel quality -- extremely useful for diagnosing where your model fails.
import numpy as np
from skimage.metrics import peak_signal_noise_ratio, structural_similarity
from skimage.color import rgb2ycbcr
from skimage.io import imread

def evaluate_sr(ref_path, sr_path, scale=4, crop_border=True):
    """
    Evaluate super-resolution quality following standard benchmark protocol.
    Computes PSNR and SSIM on the Y channel of YCbCr color space.

    Args:
        ref_path: Path to high-resolution reference image
        sr_path: Path to super-resolved image
        scale: Upscaling factor (used for border cropping)
        crop_border: Whether to crop border pixels

    Returns:
        dict with PSNR and SSIM scores
    """
    ref = imread(ref_path).astype(np.float64)
    sr = imread(sr_path).astype(np.float64)

    # Convert to YCbCr and extract Y channel
    ref_y = rgb2ycbcr(ref / 255.0)[:, :, 0] * 255.0
    sr_y = rgb2ycbcr(sr / 255.0)[:, :, 0] * 255.0

    # Crop border pixels (standard SR evaluation protocol)
    if crop_border and scale > 0:
        ref_y = ref_y[scale:-scale, scale:-scale]
        sr_y = sr_y[scale:-scale, scale:-scale]

    # Compute metrics on Y channel
    psnr = peak_signal_noise_ratio(ref_y, sr_y, data_range=255.0)
    ssim = structural_similarity(
        ref_y, sr_y,
        data_range=255.0,
        gaussian_weights=True,
        win_size=11
    )

    return {'psnr': psnr, 'ssim': ssim}

# Example: evaluate on Set5 benchmark
results = evaluate_sr(
    'Set5/baby_HR.png',
    'Set5/baby_SR_x4.png',
    scale=4
)
print(f"PSNR: {results['psnr']:.2f} dB")
print(f"SSIM: {results['ssim']:.4f}")
This is the standard protocol for evaluating super-resolution models on benchmarks like Set5, Set14, BSD100, and Urban100. Key details: (1) convert to YCbCr and evaluate on the Y (luminance) channel only, because human vision is more sensitive to luminance than chrominance, (2) crop scale pixels from each border to exclude padding artifacts, (3) use float64 for numerical precision. Deviating from this protocol makes your results incomparable with published papers.
import torch
import torch.nn.functional as F

def gaussian_kernel(size=11, sigma=1.5, channels=3):
    """Create a Gaussian kernel for SSIM computation."""
    coords = torch.arange(size, dtype=torch.float32) - size // 2
    g = torch.exp(-(coords ** 2) / (2 * sigma ** 2))
    g = torch.outer(g, g)
    g = g / g.sum()
    kernel = g.unsqueeze(0).unsqueeze(0).repeat(channels, 1, 1, 1)
    return kernel

def ssim_loss(pred, target, data_range=1.0, size=11, sigma=1.5):
    """
    Differentiable SSIM loss for training image reconstruction models.

    Args:
        pred: Predicted image tensor (B, C, H, W), range [0, data_range]
        target: Target image tensor (B, C, H, W)
        data_range: Maximum pixel value (1.0 for normalized, 255 for uint8)

    Returns:
        1 - SSIM (loss to minimize)
    """
    channels = pred.shape[1]
    kernel = gaussian_kernel(size, sigma, channels).to(pred.device)

    C1 = (0.01 * data_range) ** 2
    C2 = (0.03 * data_range) ** 2

    # Compute local statistics using convolution
    mu_pred = F.conv2d(pred, kernel, padding=size // 2, groups=channels)
    mu_target = F.conv2d(target, kernel, padding=size // 2, groups=channels)

    mu_pred_sq = mu_pred ** 2
    mu_target_sq = mu_target ** 2
    mu_pred_target = mu_pred * mu_target

    sigma_pred_sq = F.conv2d(pred ** 2, kernel, padding=size // 2, groups=channels) - mu_pred_sq
    sigma_target_sq = F.conv2d(target ** 2, kernel, padding=size // 2, groups=channels) - mu_target_sq
    sigma_pred_target = F.conv2d(pred * target, kernel, padding=size // 2, groups=channels) - mu_pred_target

    # SSIM formula
    numerator = (2 * mu_pred_target + C1) * (2 * sigma_pred_target + C2)
    denominator = (mu_pred_sq + mu_target_sq + C1) * (sigma_pred_sq + sigma_target_sq + C2)
    ssim_map = numerator / denominator

    # Return 1 - SSIM as a loss (to minimize)
    return 1.0 - ssim_map.mean()

# Example usage in training loop
pred = torch.rand(8, 3, 256, 256, requires_grad=True)   # Batch of 8 RGB images
target = torch.rand(8, 3, 256, 256)

loss = ssim_loss(pred, target, data_range=1.0)
loss.backward()  # Gradients flow through SSIM
print(f"SSIM Loss: {loss.item():.4f}")
This is a differentiable SSIM implementation suitable for use as a training loss. The key insight is that SSIM can be computed entirely using convolution operations (for local statistics), which are natively differentiable in PyTorch. Using 1 - SSIM as a loss encourages the model to maximize structural similarity. Many state-of-the-art image restoration models (SwinIR, Restormer, HAT) use a combined loss: L1 + lambda * (1 - SSIM) where lambda typically ranges from 0.1 to 1.0.
import torch
import piq

# Create sample tensors (batch of images)
# Shape: (B, C, H, W), range [0, 1]
reference = torch.rand(4, 3, 256, 256)
reconstructed = torch.rand(4, 3, 256, 256)

# PSNR (functional API)
psnr = piq.psnr(reference, reconstructed, data_range=1.0)
print(f"PSNR: {psnr.item():.2f} dB")

# SSIM (functional API)
ssim_index = piq.ssim(reference, reconstructed, data_range=1.0)
print(f"SSIM: {ssim_index.item():.4f}")

# MS-SSIM (Multi-Scale SSIM)
ms_ssim = piq.multi_scale_ssim(reference, reconstructed, data_range=1.0)
print(f"MS-SSIM: {ms_ssim.item():.4f}")

# SSIM as a differentiable loss (class API)
ssim_loss_fn = piq.SSIMLoss(data_range=1.0)
loss = ssim_loss_fn(reconstructed, reference)
loss.backward()  # Backpropagation works!
print(f"SSIM Loss: {loss.item():.4f}")

# MS-SSIM loss
ms_ssim_loss_fn = piq.MultiScaleSSIMLoss(data_range=1.0)
ms_loss = ms_ssim_loss_fn(reconstructed, reference)
print(f"MS-SSIM Loss: {ms_loss.item():.4f}")

# Compare with LPIPS for perceptual quality
lpips_loss_fn = piq.LPIPS()  # Uses VGG by default
lpips = lpips_loss_fn(reconstructed, reference)
print(f"LPIPS: {lpips.item():.4f}")
PIQ (PyTorch Image Quality) provides a comprehensive, GPU-accelerated suite of image quality metrics including PSNR, SSIM, MS-SSIM, LPIPS, and many more. All metrics support batched computation, are differentiable for use as training losses, and are rigorously tested against reference implementations. PIQ is the recommended library for production pipelines where you need multiple metrics with a consistent API.
# Evaluation configuration for image restoration pipeline
# config.yaml
evaluation:
  metrics:
    - name: psnr
      data_range: 255
      color_space: ycbcr    # Compute on Y channel
      crop_border: 4         # Crop 4px for 4x SR
    - name: ssim
      data_range: 255
      color_space: ycbcr
      win_size: 11
      gaussian_weights: true
      crop_border: 4
    - name: ms_ssim
      data_range: 255
      scales: 5
    - name: lpips
      network: vgg           # AlexNet or VGG backbone

  datasets:
    - name: Set5
      path: /data/benchmarks/Set5
      scale: 4
    - name: Set14
      path: /data/benchmarks/Set14
      scale: 4
    - name: BSD100
      path: /data/benchmarks/BSD100
      scale: 4
    - name: Urban100
      path: /data/benchmarks/Urban100
      scale: 4

  output:
    format: csv
    save_ssim_maps: true     # Save spatial SSIM maps for debugging
    log_to: wandb            # Log to Weights & Biases
Common Implementation Mistakes
- ●
Wrong data_range parameter: PSNR and SSIM require knowing the maximum possible pixel value. If your images are float32 in [0, 1] but you pass
data_range=255, PSNR will be inflated by ~48 dB and SSIM will be nearly 1.0 for any pair. Always verify:data_range=255for uint8,data_range=1.0for normalized float. - ●
Evaluating on RGB instead of Y channel for super-resolution: The standard SR benchmark protocol computes PSNR/SSIM on the Y (luminance) channel of YCbCr color space. Evaluating on RGB gives different (usually higher) numbers that are not comparable with published results. Always match the evaluation protocol of the benchmark.
- ●
Forgetting to crop borders for super-resolution evaluation: Convolution-based SR models produce boundary artifacts due to zero-padding. The standard protocol crops
scale_factorpixels from each border. Skipping this inflates SSIM because boundary artifacts drag down the average, making your model look worse than it is -- or better, depending on the baseline comparison. - ●
Using PSNR alone for perceptual quality claims: PSNR does not correlate well with human perception. A blurry, over-smoothed image often has higher PSNR than a sharp image with minor artifacts. Never claim "our model produces perceptually better results" based solely on PSNR improvements. Always complement with SSIM, MS-SSIM, or LPIPS.
- ●
Comparing PSNR across different image contents: PSNR is content-dependent. A simple sky image will have much higher PSNR than a complex texture for the same reconstruction quality. Only compare PSNR scores on the same images or the same benchmark dataset.
- ●
Not accounting for channel ordering (RGB vs BGR): OpenCV loads images as BGR by default, while PIL and scikit-image use RGB. If you mix libraries, channels get swapped, producing incorrect SSIM scores (luminance/contrast comparisons across wrong channels). Always verify channel ordering before computing metrics.
When Should You Use This?
Use When
You are evaluating image reconstruction quality (super-resolution, denoising, deblurring, inpainting, compression) and have access to ground-truth reference images for comparison
You need a fast, cheap, deterministic metric for tracking model progress during training or CI/CD validation -- PSNR/SSIM are computed in milliseconds with zero external dependencies
You are benchmarking against published results that report PSNR/SSIM (virtually all super-resolution and image restoration papers since 2000) and need comparable numbers
You want a differentiable loss function that encourages structural preservation during training -- SSIM loss can be combined with L1 or perceptual loss for better reconstruction quality
You need a spatial quality map (SSIM map) to diagnose where your model fails at a per-pixel level, rather than just a single aggregate score
You are evaluating video codec quality (JPEG, H.264, H.265, AV1) where PSNR is the industry-standard metric and SSIM provides a complementary perceptual view
Avoid When
You are evaluating generative models (GANs, diffusion models, VAEs) that produce novel images with no single correct ground truth -- use FID, KID, or IS instead, which compare distributions rather than individual image pairs
You need a metric that correlates strongly with human perception -- PSNR has weak perceptual correlation, and even SSIM can disagree with human judgments for certain distortion types. Use LPIPS (learned perceptual metric) or conduct human evaluations for perceptual claims
Your images contain global geometric distortions (rotation, scaling, warping) -- PSNR and SSIM assume pixel-wise alignment. Even a 1-pixel shift will severely degrade both metrics. Use alignment-robust metrics or register images first
You are comparing across different image contents or datasets -- PSNR is heavily content-dependent (a flat sky has higher PSNR than a complex texture for the same distortion level). Only compare within the same benchmark
You need to evaluate text, logos, or other images with discrete structures where even tiny pixel errors are perceptually important -- PSNR/SSIM may underweight these errors relative to their perceptual impact
Key Tradeoffs
PSNR vs. SSIM: When to Use Which
PSNR and SSIM are complementary, not competitive. In practice, report both:
| Aspect | PSNR | SSIM |
|---|---|---|
| What it measures | Pixel-level fidelity (MSE-based) | Structural similarity (luminance + contrast + structure) |
| Perceptual correlation | Weak -- treats all errors equally | Moderate -- captures structural distortions |
| Computation cost | O(1) per pixel, essentially free | O(W) per pixel (W = window size), ~20x slower than PSNR |
| Use as loss function | Equivalent to L2/MSE loss (causes blurring) | Differentiable, encourages structural preservation |
| Industry standard | Video compression, telecommunications | Image restoration, super-resolution |
The Perceptual Gap: Why You Need More Than PSNR/SSIM
The fundamental limitation of both metrics is that higher PSNR/SSIM does not always mean better perceptual quality. This is called the "perception-distortion tradeoff" (Blau & Michaeli, ICML 2018):
- Models that maximize PSNR/SSIM tend to produce blurry, over-smoothed outputs. This is because the optimal reconstruction under MSE/L2 loss is the conditional mean, which averages out high-frequency details.
- Models that maximize perceptual quality (sharp, detailed images) may have lower PSNR/SSIM because they introduce realistic but not pixel-accurate details.
This tradeoff is inherent -- you cannot simultaneously maximize pixel fidelity and perceptual quality. The practical implication: for super-resolution and image generation, always report PSNR/SSIM alongside perceptual metrics (LPIPS, FID) to give a complete picture.
Cost Considerations
For a team in India evaluating a super-resolution model on 1,000 test images:
- PSNR + SSIM: ~2 seconds on GPU, ~₹0.10 on AWS
- PSNR + SSIM + LPIPS: ~30 seconds on GPU (LPIPS requires VGG forward pass), ~₹1 on AWS
- PSNR + SSIM + LPIPS + FID: ~5 minutes (FID needs 10K+ images), ~₹10 on AWS
PSNR/SSIM are effectively free; the question is whether to invest in additional perceptual metrics for more reliable evaluation.
Alternatives & Comparisons
FID measures distributional similarity between generated and real images -- it does not require paired reference images. Use FID for evaluating generative models (GANs, diffusion models) where there is no single correct output. Use PSNR/SSIM for reconstruction tasks (super-resolution, denoising, compression) where you have ground-truth reference images. FID and PSNR/SSIM answer fundamentally different questions: FID asks 'does the generated set look like the real set?', while PSNR/SSIM asks 'how close is this specific output to this specific reference?'
IoU measures spatial overlap between regions (bounding boxes, segmentation masks) and is used for object detection and segmentation evaluation. PSNR/SSIM measure pixel-level image fidelity for reconstruction tasks. They operate in completely different domains: IoU for spatial localization, PSNR/SSIM for signal fidelity. You would not use one in place of the other -- but a vision system might report both (e.g., a super-resolution model evaluated with PSNR/SSIM, followed by an object detector evaluated with IoU/mAP on the super-resolved images).
PSNR is mathematically derived from MSE (PSNR = 10 * log10(MAX^2 / MSE)), so they contain the same information -- PSNR is just MSE on a logarithmic, normalized scale. The advantage of PSNR over raw MSE is interpretability: PSNR values (in dB) are comparable across images with different dynamic ranges and resolutions, while raw MSE values are not. For reporting image quality, always prefer PSNR over MSE; for loss functions during training, MSE (L2 loss) is mathematically equivalent to optimizing PSNR.
Pros, Cons & Tradeoffs
Advantages
Universally adopted -- PSNR and SSIM are the most widely reported image quality metrics in computer vision research, compression standards (JPEG, H.264, AV1), and super-resolution benchmarks (Set5, Set14, BSD100, Urban100). Reporting these metrics makes your work directly comparable with decades of published research.
Computationally trivial -- PSNR requires only MSE computation (microseconds), and SSIM adds a sliding-window convolution (
milliseconds on GPU). For a production pipeline evaluating thousands of images, total compute cost is negligible (₹0.10 on AWS for 1,000 images).No learned parameters -- Unlike LPIPS or FID, PSNR and SSIM require no pre-trained neural networks. They are deterministic, reproducible, and independent of framework version, GPU type, or random seed. This makes them ideal for CI/CD pipelines and automated testing.
SSIM is differentiable and can be used directly as a training loss function. Models trained with SSIM loss produce sharper, more structurally accurate outputs compared to pure L2/MSE loss, which tends toward blurry reconstructions.
SSIM provides spatial quality maps -- the per-pixel SSIM map reveals exactly which image regions are well-reconstructed and which are degraded. This is invaluable for debugging model failures and understanding where your reconstruction pipeline loses quality.
Well-understood mathematical properties -- Both metrics have clear formulas, known sensitivity characteristics, and decades of analysis in the signal processing literature. You know exactly what they measure and what they miss, unlike black-box neural metrics.
PSNR is codec-agnostic and standardized -- ITU-T, MPEG, and JPEG all use PSNR as a primary quality metric. If you are building a video streaming pipeline or image compression system, PSNR is non-negotiable for benchmarking.
Disadvantages
PSNR has weak correlation with human perception -- it treats all pixel errors equally, so a slight global brightness shift (barely noticeable) produces the same PSNR as structured noise (very noticeable). Never use PSNR alone to claim perceptual quality improvements.
Both metrics favor blurry over sharp images -- a blurry, over-smoothed reconstruction often scores higher on PSNR and SSIM than a sharp, detailed image with minor artifacts. This is the perception-distortion tradeoff, and it means maximizing PSNR/SSIM can lead to visually inferior outputs.
Require paired reference images (full-reference metrics) -- you must have the ground truth image to compute PSNR/SSIM. For tasks where no single correct answer exists (generative modeling, style transfer, text-to-image), these metrics are inapplicable.
SSIM is sensitive to implementation details -- window size, Gaussian sigma, boundary handling, and color space can all affect SSIM values. Different libraries (scikit-image, MATLAB, PyTorch) may produce slightly different results, complicating cross-paper comparisons.
Content-dependent absolute values -- PSNR of 30 dB on a smooth sky image and 30 dB on a complex urban scene represent very different quality levels. You cannot compare PSNR values across different images without accounting for content complexity.
Neither metric captures high-level semantic distortions -- if a super-resolution model hallucinate a plausible but incorrect texture (e.g., wrong fabric pattern on clothing), PSNR/SSIM may penalize it heavily even though a human viewer would find it acceptable. Conversely, subtle but semantically important errors (wrong text on a sign) may barely register.
Failure Modes & Debugging
Blurry reconstructions score higher than sharp ones
Cause
PSNR (and to a lesser extent SSIM) is minimized by the conditional mean of the pixel distribution, which is the blurry average of all possible reconstructions. Models trained to maximize PSNR learn to produce safe, blurry outputs that avoid large pixel errors rather than committing to sharp, detailed predictions that risk being wrong.
Symptoms
Your model achieves state-of-the-art PSNR on benchmarks but the outputs look visibly blurry and lack fine detail compared to competitors with lower PSNR. Users or stakeholders complain about image quality despite good quantitative numbers. GAN-based models with better visual quality have lower PSNR than your regression-based model.
Mitigation
Complement PSNR/SSIM with perceptual metrics (LPIPS, MS-SSIM) that penalize blurriness. Use a combined loss during training: L1 + lambda_ssim * (1 - SSIM) + lambda_lpips * LPIPS. Report the perception-distortion tradeoff explicitly -- show that your model achieves a good balance between PSNR (fidelity) and LPIPS (perceptual quality). For production deployments, always include human evaluation in addition to automated metrics.
Global intensity/contrast shift yields misleading PSNR
Cause
PSNR treats all pixel errors equally regardless of their spatial distribution or perceptual impact. A uniform brightness offset of +10 to every pixel and random salt-and-pepper noise with the same total MSE produce identical PSNR, even though the brightness shift is barely noticeable while the noise is highly visible.
Symptoms
Two distorted images with the same PSNR look completely different to human viewers. Models that learn global color/brightness biases achieve unexpectedly high PSNR without actually preserving image content. A/B tests disagree with PSNR rankings -- users prefer the image with lower PSNR.
Mitigation
Use SSIM alongside PSNR -- SSIM is robust to uniform intensity shifts because it normalizes for mean luminance. For stricter evaluation, use MS-SSIM which is even more robust across scales. When global brightness/contrast calibration is important (e.g., medical imaging, color-critical photography), add explicit color fidelity metrics (delta-E in Lab color space).
Misaligned images produce catastrophically low scores
Cause
PSNR and SSIM assume perfect pixel-wise alignment between reference and distorted images. Even a 1-pixel spatial shift between the images will dramatically reduce both metrics, because every pixel is compared against the wrong reference pixel.
Symptoms
PSNR/SSIM scores are much lower than expected despite visually excellent reconstruction. Scores improve dramatically when you slightly shift one image relative to the other. This is common in super-resolution (where subpixel alignment errors occur) and video frame evaluation (where motion compensation is imperfect).
Mitigation
For super-resolution, ensure you use the exact same downscaling method to create the low-resolution input as the benchmark specifies (typically MATLAB bicubic). For video, apply motion compensation before computing metrics. Consider using alignment-robust variants like shift-compensated PSNR. For production pipelines, add an alignment verification step (compute correlation to detect shifts) before computing quality metrics.
SSIM saturates at high quality levels
Cause
When image quality is very high (SSIM > 0.95), the metric becomes insensitive to further improvements. The difference between SSIM 0.97 and 0.99 may represent significant visual improvement but the numerical gap is tiny, making it difficult to distinguish between high-quality models.
Symptoms
Multiple models with visibly different quality levels all cluster around SSIM 0.97-0.99, making it impossible to rank them meaningfully. Improvements that humans can clearly see do not move the SSIM needle. Statistical significance tests fail because SSIM differences are smaller than measurement noise.
Mitigation
Use 1 - SSIM (DSSIM) to spread out the high-quality range on a linear scale. Complement SSIM with LPIPS which has better discrimination at high quality levels. Report metrics at multiple precision levels (4 decimal places for SSIM). Consider MS-SSIM which has better sensitivity across quality ranges than single-scale SSIM. For benchmark papers, report statistical confidence intervals.
Wrong data_range silently produces meaningless scores
Cause
Both PSNR and SSIM use the data_range (or MAX_I) parameter to normalize computations. If your images are float32 in [0, 1] but you pass data_range=255, or vice versa, the metrics will compute without error but produce completely wrong values.
Symptoms
PSNR values are implausibly high (>70 dB) or implausibly low (<10 dB) for images that look reasonable. SSIM is nearly 1.0 for images with visible differences. Different team members report different metrics for the same model because they use different data ranges.
Mitigation
Add validation assertions at the start of your evaluation pipeline: check that pixel values fall within [0, data_range] and that the images have the expected dtype (uint8 vs float32). Standardize the data pipeline across your team with a shared configuration file. Document the expected format in code comments. Consider wrapping metrics in a helper function that auto-detects the range from dtype.
Placement in an ML System
PSNR and SSIM sit in the evaluation stage of the ML pipeline, immediately after model inference produces reconstructed/enhanced images. They are the first metrics computed during evaluation because they are fast, deterministic, and universally understood.
During Training: SSIM (or MS-SSIM) is used as a loss component alongside L1 loss and sometimes perceptual loss. The combined loss guides the model to balance pixel accuracy (L1), structural preservation (SSIM), and perceptual quality (LPIPS). PSNR is logged every N epochs to the experiment tracker for monitoring convergence.
During Evaluation: After training, PSNR and SSIM are computed on standard benchmark datasets (Set5, Set14, BSD100, Urban100 for super-resolution; CBSD68, McMaster for denoising). These numbers go into papers, model cards, and release notes.
During Deployment: In production image processing systems (e.g., an image CDN that applies super-resolution or compression), PSNR/SSIM may be computed on a sample of processed images to monitor quality. A sudden drop in SSIM across the pipeline signals a regression -- perhaps a model update introduced artifacts, or an upstream data format change corrupted the inputs.
In CI/CD: Automated tests may include PSNR/SSIM regression checks: "if PSNR on the validation set drops by more than 0.5 dB compared to the previous release, block deployment." This is straightforward to implement because the metrics are fast and deterministic.
Production Pattern: For an Indian startup building an image enhancement service (e.g., improving product photos for Flipkart sellers), the evaluation pipeline might compute PSNR/SSIM on a curated test set of 500 product images, log to Weights & Biases, and gate deployment behind a minimum SSIM threshold of 0.92. Total evaluation cost: ~₹5 per model candidate on a p3.2xlarge instance.
Pipeline Stage
Evaluation
Upstream
- super-resolution-model
- image-denoising
- image-compression
- model-training
- full-fine-tuning
Downstream
- model-registry
- model-selection
- canary-deploy
- monitoring-dashboard
Scaling Bottlenecks
PSNR and SSIM are computationally lightweight -- the bottleneck is never the metric itself but rather image I/O and preprocessing. Loading 1,000 high-resolution images (4K) from disk takes longer than computing all three metrics (PSNR, SSIM, MS-SSIM) combined.
For scale estimates: evaluating 10,000 images at 1080p resolution takes ~10 seconds on an NVIDIA V100 for PSNR+SSIM, with ~90% of the time spent on disk I/O. For MS-SSIM, add ~5 seconds for the multi-scale pyramid construction.
The real scaling concern is when you use SSIM as a training loss. Computing SSIM loss on every training batch adds ~2ms per 256x256 image on GPU. For a batch size of 32, that is ~64ms per iteration -- negligible compared to the model forward/backward pass (~200-500ms for a typical restoration network).
For production monitoring at scale (e.g., evaluating image quality across a CDN serving millions of images), consider sampling-based evaluation: compute PSNR/SSIM on a representative sample of 1,000-10,000 images rather than the entire corpus. This reduces evaluation time from hours to seconds while maintaining statistical reliability.
Production Case Studies
NVIDIA's ESRGAN (Enhanced Super-Resolution GAN) paper used PSNR and SSIM as primary evaluation metrics alongside perceptual quality measures. ESRGAN achieved PSNR of ~32.7 dB and SSIM of ~0.9011 on the Set5 benchmark (4x upscaling) for their PSNR-oriented model. However, the paper explicitly demonstrated the perception-distortion tradeoff: their perceptual-quality-oriented model had lower PSNR (~31.2 dB) but produced visually sharper images that won the PIRM Challenge at ECCV 2018. This case study perfectly illustrates why PSNR alone is insufficient -- NVIDIA reported both PSNR/SSIM and perceptual metrics to give a complete picture.
ESRGAN became one of the most widely used super-resolution models. The explicit acknowledgment of the perception-distortion tradeoff influenced the field to always report both fidelity metrics (PSNR/SSIM) and perceptual metrics (LPIPS, PI) -- a practice now standard in image restoration research.
Netflix developed VMAF (Video Multimethod Assessment Fusion) because PSNR and SSIM were insufficient for their video quality evaluation needs. Their engineering blog documented how PSNR failed to distinguish between compression artifacts that users noticed and those they did not -- a codec could achieve high PSNR while producing visible banding or blocking artifacts. SSIM performed better but still had blind spots for temporal artifacts (flickering, judder) in video. Netflix's solution was to train a machine learning model (VMAF) that combines PSNR, SSIM, and other features with human quality ratings. However, they still use PSNR and SSIM as input features to VMAF and as baseline metrics for internal codec benchmarking.
VMAF is now the industry standard for video quality at Netflix (processing billions of encoded segments). But PSNR/SSIM remain as fundamental building blocks -- VMAF uses them as features, and codec engineers still reference PSNR for bit-rate optimization. This case study shows that PSNR/SSIM are necessary but not sufficient for production quality assessment.
Google's learned image compression research (Balle et al., ICLR 2017) used PSNR and MS-SSIM as primary evaluation metrics to demonstrate that neural image codecs can outperform traditional codecs (JPEG, JPEG2000, WebP) at the same bit rate. They plotted rate-distortion curves with PSNR (dB) on the y-axis and bits-per-pixel on the x-axis, showing their learned codec achieving higher PSNR at lower bit rates. They also showed MS-SSIM rate-distortion curves, which revealed an even larger advantage for the neural codec -- because neural codecs tend to preserve structural information better than traditional block-based codecs, MS-SSIM captures this advantage more accurately than PSNR.
This work laid the foundation for learned image compression, eventually influencing standards like AVIF and the JPEG AI initiative. The use of both PSNR and MS-SSIM rate-distortion curves became the standard evaluation methodology for neural codec papers.
Tencent's Real-ESRGAN model for real-world super-resolution faced a unique evaluation challenge: real-world degraded images have no ground-truth reference, making PSNR/SSIM computation impossible. For synthetic benchmarks (where references exist), Real-ESRGAN achieved PSNR ~24.97 dB and SSIM ~0.76 on 4x upscaling tasks. However, the team recognized that these numbers underrepresent the model's real-world performance because PSNR/SSIM penalize the model for adding sharp, realistic details that don't exactly match the reference. They complemented PSNR/SSIM with no-reference metrics (NIQE, PI) and extensive user studies to demonstrate the model's practical utility.
Real-ESRGAN became one of the most popular image enhancement tools (integrated into numerous apps and services). The case illustrates that for real-world applications, PSNR/SSIM serve as a baseline sanity check, but user-facing quality requires perceptual and no-reference metrics.
Tooling & Ecosystem
The reference Python implementation of PSNR and SSIM for evaluation. Part of the scikit-image library, which is the standard for image processing in Python. Provides peak_signal_noise_ratio() and structural_similarity() with options for data range, window size, Gaussian weighting, and spatial SSIM maps. CPU-only but sufficient for evaluation (not training). Recommended for reproducible evaluation because it matches MATLAB's reference implementation closely.
Comprehensive PyTorch library with GPU-accelerated, differentiable implementations of 30+ image quality metrics including PSNR, SSIM, MS-SSIM, LPIPS, FID, BRISQUE, and more. All metrics support batched computation and backpropagation. Rigorously tested against reference implementations. Provides both functional API and class-based API (for use as training losses). Recommended for production pipelines that need multiple metrics with a consistent interface and GPU acceleration.
PSNR and SSIM implementations integrated into PyTorch Lightning's metrics framework. Supports distributed training (multi-GPU metric synchronization), streaming computation (accumulate across batches), and seamless integration with Lightning training loops. Provides PeakSignalNoiseRatio and StructuralSimilarityIndexMeasure classes. Recommended for teams already using PyTorch Lightning for training infrastructure.
Comprehensive PyTorch toolbox for Image Quality Assessment (IQA) with implementations of PSNR, SSIM, LPIPS, FID, NIQE, NRQM, MUSIQ, TOPIQ, NIMA, DBCNN, BRISQUE, and many more. Includes both full-reference (PSNR, SSIM) and no-reference (NIQE, BRISQUE) metrics. Provides a unified pyiqa API for all metrics. Particularly useful for research that needs to compare across many metrics. Actively maintained with regular additions of new metrics.
Lightweight PyTorch library where each metric is a torch.nn.Module, making it easy to integrate into training pipelines as loss functions. Supports PSNR, SSIM, MS-SSIM, LPIPS, GMSD, and more. All metrics are differentiable and support CPU/GPU. Minimal dependencies (pure PyTorch). Recommended for research prototyping where you want clean, readable metric implementations.
MATLAB's Image Processing Toolbox provides psnr(), ssim(), and multissim() (MS-SSIM) functions. Historically the reference implementation for computer vision research -- many published benchmark numbers were computed using MATLAB's SSIM. If you are reproducing results from older papers (pre-2020), MATLAB's implementation is the gold standard for exact reproducibility. Note: Some Python implementations produce slightly different SSIM values than MATLAB due to boundary handling differences.
Research & References
Wang, Z., Bovik, A. C., Sheikh, H. R., & Simoncelli, E. P. (2004)IEEE Transactions on Image Processing
The landmark paper that introduced SSIM. Proposes decomposing image quality into luminance, contrast, and structure components, demonstrating that SSIM correlates much better with human perception than MSE/PSNR. Cited over 60,000 times and awarded the IEEE Signal Processing Society Best Paper Award. This paper is essential reading for anyone working with image quality metrics.
Wang, Z., Simoncelli, E. P., & Bovik, A. C. (2003)Asilomar Conference on Signals, Systems and Computers
Extends SSIM to multiple spatial scales (MS-SSIM), accounting for the fact that human vision processes images at different resolutions. MS-SSIM outperforms single-scale SSIM in subjective quality prediction, especially for images viewed at varying distances. The multi-scale approach is now widely used as both a metric and a training loss.
Zhang, R., Isola, P., Efros, A. A., Shechtman, E., & Wang, O. (2018)CVPR 2018
Introduces LPIPS, a learned perceptual metric that uses deep network features to predict human perceptual similarity. Demonstrates that LPIPS significantly outperforms PSNR and SSIM in correlating with human judgments. Shows that even unsupervised deep features work better than handcrafted metrics. This paper motivated the shift toward perceptual metrics in image restoration research.
Blau, Y. & Michaeli, T. (2018)ICML 2018
Proves a fundamental theorem: there is an inherent tradeoff between distortion metrics (PSNR, SSIM) and perceptual quality metrics (FID, LPIPS). Improving one necessarily worsens the other. This has profound implications for model design -- you cannot build a model that simultaneously maximizes PSNR and perceptual quality. The paper formalized what practitioners had observed empirically.
Wang, X., Yu, K., Wu, S., Gu, J., Liu, Y., Dong, C., Qiao, Y., & Loy, C. C. (2018)ECCV 2018 Workshops
Demonstrates the perception-distortion tradeoff in practice: the PSNR-oriented model achieves higher PSNR/SSIM but looks blurry, while the perception-oriented model (ESRGAN) has lower PSNR but produces sharper, more visually appealing images. Won the PIRM Challenge for perceptual super-resolution. This paper established the practice of reporting both fidelity (PSNR/SSIM) and perceptual (LPIPS, PI) metrics.
Interview & Evaluation Perspective
Common Interview Questions
- ●
What is PSNR and how is it related to MSE?
- ●
Explain SSIM -- what are the three components and why does it outperform PSNR for perceptual quality?
- ●
A super-resolution model has higher PSNR but produces blurrier images than a GAN-based model. Why does this happen?
- ●
When would you use PSNR/SSIM vs. LPIPS vs. FID for evaluating image quality?
- ●
How would you set up an automated evaluation pipeline for a production image enhancement service?
- ●
What is the perception-distortion tradeoff and how does it affect model design?
- ●
Your model achieves 0.3 dB higher PSNR on the benchmark. Is this a meaningful improvement?
Key Points to Mention
- ●
PSNR measures pixel-level fidelity via MSE on a logarithmic (dB) scale. Higher is better. Typical range: 25-45 dB for image tasks.
- ●
SSIM decomposes quality into luminance, contrast, and structure components, capturing perceptual aspects that pure pixel comparison misses. Range: [0, 1], higher is better.
- ●
Both are full-reference metrics -- they require a ground-truth image. For generative tasks without references, use FID/IS instead.
- ●
PSNR has weak perceptual correlation -- it treats all pixel errors equally. SSIM is better but still imperfect. For strong perceptual correlation, use LPIPS.
- ●
The perception-distortion tradeoff (Blau & Michaeli, 2018) proves you cannot simultaneously maximize PSNR and perceptual quality. Models optimizing PSNR tend to produce blurry outputs.
- ●
Standard SR evaluation protocol: compute on Y channel (YCbCr), crop borders by
scale_factor, use float64 precision. - ●
Always report PSNR/SSIM alongside perceptual metrics (LPIPS, MS-SSIM) for a complete evaluation picture.
Pitfalls to Avoid
- ●
Claiming perceptual superiority based only on PSNR improvements -- PSNR does not reliably predict human preference, especially for sharpness vs. fidelity tradeoffs.
- ●
Not specifying evaluation protocol details (color space, border cropping, data range) -- this makes results irreproducible and incomparable.
- ●
Confusing PSNR with perceptual quality -- a common senior-level red flag. High PSNR means low pixel error, not necessarily high visual quality.
- ●
Ignoring the perception-distortion tradeoff -- suggesting you can build a model that maximizes both PSNR and perceptual quality simultaneously shows a gap in understanding.
- ●
Not mentioning MS-SSIM or LPIPS as complements -- shows limited awareness of the modern evaluation landscape beyond PSNR/SSIM.
Senior-Level Expectation
Senior candidates should discuss the perception-distortion tradeoff and its implications for loss function design (L1 + SSIM + LPIPS as a combined loss). They should explain why different metrics are needed for different audiences (PSNR for codec benchmarking, LPIPS for user-facing quality, FID for generative diversity). They should know the standard evaluation protocol details (Y channel, border cropping, float64) and why deviating from them invalidates comparisons. For system design roles, they should describe an end-to-end evaluation pipeline: computing PSNR/SSIM/LPIPS on benchmark datasets, logging to experiment tracking (W&B, MLflow), gating deployments behind metric thresholds, and monitoring quality in production. They should also discuss when PSNR/SSIM fail and what alternatives exist: LPIPS for perceptual quality, FID for generative distribution fidelity, VMAF for video quality (Netflix's approach), and no-reference metrics (NIQE, BRISQUE) when references are unavailable.
Summary
PSNR and SSIM are the foundational metrics for image quality assessment in computer vision and signal processing. PSNR, based on mean squared error expressed in decibels, measures pixel-level fidelity -- how accurately the reconstructed image matches the reference at every pixel. SSIM goes deeper, decomposing quality into luminance, contrast, and structure comparisons that better model how the human visual system perceives images. Together, they provide a fast, deterministic, parameter-free baseline for evaluating any image reconstruction task.
These metrics are ubiquitous. Every super-resolution paper reports PSNR and SSIM on standard benchmarks (Set5, Set14, BSD100, Urban100). Every video codec (JPEG, H.264, AV1) is benchmarked using PSNR. Every denoising algorithm from classical BM3D to modern Restormer includes both metrics in its evaluation. The practical advantage is clear: they are computationally trivial (milliseconds on GPU), require no learned parameters, and provide reproducible results across implementations.
However, PSNR and SSIM have well-documented limitations. PSNR treats all pixel errors equally, ignoring their perceptual impact -- a global brightness shift and random noise can produce the same PSNR despite vastly different visual quality. Even SSIM, while better, favors blurry reconstructions over sharp ones because blur reduces local variance without destroying structural patterns. The perception-distortion tradeoff (Blau & Michaeli, 2018) proves this is fundamental: you cannot simultaneously maximize pixel fidelity and perceptual quality.
The modern best practice is to use PSNR and SSIM as baseline fidelity metrics alongside perceptual metrics like LPIPS and MS-SSIM. For super-resolution and image restoration, the standard evaluation suite includes PSNR (Y channel, border-cropped), SSIM, and LPIPS. For video, Netflix's VMAF uses PSNR and SSIM as input features but adds temporal modeling and human-calibrated quality prediction. For generative models without references, these metrics are replaced entirely by distribution-level metrics like FID.
For ML engineers building production image systems in India -- whether enhancing product photos for e-commerce platforms like Flipkart, optimizing video quality for streaming services like Hotstar, or developing medical imaging tools for hospital chains like Apollo -- understanding PSNR and SSIM is non-negotiable. They are the starting point of every image quality conversation, the metrics your stakeholders expect to see in reports, and the building blocks upon which more sophisticated evaluation pipelines are constructed.