Alerting System in Machine Learning
An alerting system is the critical feedback loop that transforms passive monitoring into active incident response for production ML systems. Without alerting, your dashboards are just expensive screensavers -- pretty charts that nobody looks at until something is already on fire.
In ML systems, alerting goes far beyond traditional infrastructure monitoring. Yes, you still need alerts for CPU saturation and out-of-memory kills. But the real challenge is detecting model-level degradation: silent accuracy drops, prediction drift, feature distribution shifts, and the slow rot that makes your model confidently wrong. A recommendation engine at Flipkart serving stale embeddings, a fraud detection model at Razorpay missing new attack patterns, a delivery ETA model at Swiggy consistently under-predicting during monsoon season -- these failures don't throw exceptions. They require purpose-built alerting that understands ML-specific failure modes.
Modern ML alerting systems combine threshold-based rules ("alert if latency P99 > 200ms"), anomaly detection ("alert if prediction distribution deviates from historical baseline"), and composite alerts ("alert only if drift AND accuracy drop co-occur") to provide high-signal, low-noise notifications. They integrate with incident management platforms like PagerDuty and Grafana OnCall, enforce escalation policies, and link to runbooks that guide on-call engineers through diagnosis and remediation.
The goal is simple to state and hard to achieve: every alert should be actionable, and every actionable problem should generate an alert. Getting this balance right -- avoiding both alert fatigue and silent failures -- is one of the defining operational challenges of production ML.
Concept Snapshot
- What It Is
- An automated system that evaluates ML model health metrics against predefined rules or learned baselines and triggers notifications when anomalies, degradation, or threshold violations are detected.
- Category
- Monitoring
- Complexity
- Intermediate
- Inputs / Outputs
- Inputs: metric streams (latency, accuracy, drift scores, feature statistics, prediction distributions) from metrics collectors and drift detectors. Outputs: alert notifications (Slack, PagerDuty, email, SMS) with severity, context, and linked runbooks.
- System Placement
- Sits downstream of metrics collectors, drift detectors, and logging systems; upstream of incident management, on-call rotation, and remediation workflows.
- Also Known As
- alert manager, alerting pipeline, incident alerting, model alerting, ML observability alerts, monitoring alerts
- Typical Users
- ML Engineers, MLOps Engineers, Site Reliability Engineers (SREs), Data Scientists, Platform Engineers, On-call Responders
- Prerequisites
- Metrics collection (Prometheus, custom collectors), Basic statistical concepts (mean, standard deviation, percentiles), Understanding of ML model evaluation metrics, Incident management fundamentals
- Key Terms
- threshold alertanomaly-based alertcomposite alertescalation policyrunbookon-call rotationalert fatigueseverity levelsburn rateerror budgetSLO-based alertingpaging vs non-paging
Why This Concept Exists
The Problem: ML Models Fail Silently
Traditional software fails loudly. A null pointer exception crashes your service, a database timeout returns an error code, a network partition triggers a retry storm. These failures are observable by default -- your standard infrastructure monitoring catches them immediately.
ML models fail differently. A recommendation model that starts surfacing irrelevant products doesn't crash. A fraud detection model that misses a new attack vector doesn't throw an exception. A credit scoring model that becomes biased against a demographic group continues to return scores in the expected range. These are silent failures -- the model keeps serving predictions, the API returns 200 OK, and the system looks perfectly healthy from an infrastructure perspective.
Research from MIT, Harvard, and Cambridge found that 91% of ML models degrade over time after deployment. The causes are varied: data drift, concept drift, upstream feature pipeline changes, seasonal shifts, and the general tendency of the world to change while your model stays frozen. Without proactive alerting, these degradations compound until a human notices -- often a business stakeholder asking "why did revenue drop 15% this week?" -- by which time significant damage has already been done.
The Evolution of ML Alerting
The first generation of ML alerting was borrowed directly from infrastructure monitoring: static thresholds on latency and error rates. This caught catastrophic failures (model server down, 500 errors spiking) but missed the subtle degradation that defines most ML failures.
The second generation introduced statistical alerting: monitoring prediction distributions, feature statistics, and drift scores. Tools like Evidently AI and NannyML made it possible to detect distributional shifts without ground truth labels. But these systems often produced an overwhelming volume of alerts, many of which were benign distributional changes that didn't affect business outcomes.
The current generation focuses on composite, SLO-based alerting inspired by Google's SRE practices. Instead of alerting on every metric independently, modern systems define Service Level Objectives (SLOs) -- for example, "95% of predictions should have a confidence score above 0.7" -- and alert when the error budget burn rate indicates the SLO will be breached. This approach, documented in the Google SRE Workbook, dramatically reduces alert noise while maintaining sensitivity to real problems.
Key Insight: The fundamental challenge isn't detecting anomalies -- it's distinguishing anomalies that matter from those that don't. Alert fatigue kills more ML systems than missed alerts do, because a team drowning in noise eventually starts ignoring everything, including the critical signals.
The Hidden Technical Debt Connection
Google's seminal 2015 paper "Hidden Technical Debt in Machine Learning Systems" (Sculley et al.) identified monitoring and alerting as one of the most under-invested areas in production ML. The paper argued that comprehensive live monitoring with automated response is essential for long-term system reliability, yet most teams invest the majority of their effort in model training and almost none in production observability. A decade later, this observation remains painfully accurate for most organizations.
Core Intuition & Mental Model
The Fire Station Analogy
Think of an ML alerting system like a fire station for your model. The fire station doesn't prevent fires (that's your data validation, testing, and guardrails). Instead, it has three jobs: (1) detect fires quickly through smoke detectors and alarm systems, (2) dispatch the right team based on the severity and type of fire, and (3) provide the firefighters with the right tools and building blueprints (runbooks) to fight the specific fire efficiently.
A bad fire station alerts on every wisp of smoke -- the burnt toast in the break room, the candle in the conference room, the steam from the dishwasher. Eventually, the firefighters stop responding. This is alert fatigue, and it's the number one failure mode of alerting systems. A good fire station has smart smoke detectors that distinguish between actual fires and benign smoke, and dispatches different responses for different scenarios: a grease fire in the kitchen gets a different response than an electrical fire in the server room.
Three Types of ML Alerts
At its core, an ML alerting system combines three complementary detection strategies:
Threshold-based alerts are the simplest: "if P99 latency exceeds 200ms, page the on-call engineer." They're deterministic, easy to understand, and perfect for metrics with well-known acceptable ranges. But they require someone to know the right threshold in advance, and they can't adapt to seasonal patterns or gradual trends.
Anomaly-based alerts use statistical or ML methods to learn what "normal" looks like from historical data, then flag deviations. They adapt to changing baselines and can detect novel failure modes. But they produce more false positives and require careful tuning of sensitivity.
Composite alerts combine multiple signals: "alert only if feature drift AND prediction distribution shift AND accuracy drop all co-occur within a 30-minute window." These dramatically reduce noise because any single signal might be benign, but the combination is almost always indicative of a real problem.
The art of ML alerting is knowing which strategy to apply to which metric, and how to combine them for maximum signal-to-noise ratio.
Mental Model: Threshold alerts catch known knowns, anomaly alerts catch known unknowns, and composite alerts reduce the noise from false unknowns. A production system needs all three.
Technical Foundations
Formal Framework for ML Alerting
An alerting system can be formally described as a function that maps a stream of metric observations to a set of alert decisions.
Metric Stream: Let represent the set of monitored metrics at time , where each .
Alert Rule: An alert rule is a predicate function:
where is the lookback window size. The rule evaluates to 1 (alert fires) or 0 (no alert) based on the metric values over the window.
Threshold-Based Rules
A static threshold rule for metric is:
where is the fixed threshold and is the indicator function.
Anomaly-Based Rules (Z-Score)
A z-score anomaly rule compares current observations against a rolling baseline:
where and are the rolling mean and standard deviation over window , and is the sensitivity parameter (typically , corresponding to roughly 2-4 standard deviations).
SLO Burn-Rate Alerting
Following Google's SRE framework, burn-rate alerting monitors how quickly the error budget is being consumed. Given an SLO target (e.g., 99.9% success rate) over a compliance period (e.g., 30 days), the error budget is . The burn rate over a window is:
An alert fires when the burn rate exceeds a threshold that indicates the SLO will be breached if the current rate continues:
For example, with a 30-day SLO and a 1-hour alerting window, a burn rate above means the entire monthly error budget would be consumed in 1 hour -- a situation worth paging someone at 3 AM.
Composite Alert Logic
Composite alerts combine multiple rules with boolean logic and temporal constraints:
where allows for temporal offset between correlated signals. This is particularly useful for ML systems where feature drift () typically precedes prediction drift () which precedes accuracy degradation ().
Alert Quality Metrics
The effectiveness of an alerting system is measured by:
- Precision: -- high precision means low false positive rate
- Recall: -- high recall means few missed incidents
- Time to Detect (TTD): -- lower is better
- Alert-to-Incident Ratio: -- ideally close to 1.0; ratios above 5 indicate significant noise
Industry Benchmark: SOC teams field an average of 4,484 alerts per day, with 67% ignored. For ML systems, targeting an alert precision above 80% and an alert-to-incident ratio below 3 is a reasonable starting point.
Internal Architecture
A production ML alerting system consists of five interconnected layers: metric ingestion, rule evaluation, alert routing, notification delivery, and feedback/tuning. The design must handle high-throughput metric streams, evaluate rules with low latency, and deliver notifications reliably even during infrastructure failures.
The architecture follows the observe-decide-act pattern. The observe layer continuously ingests metrics from multiple sources (Prometheus scrapers, custom ML metric exporters, drift detection services). The decide layer evaluates alerting rules -- threshold checks, anomaly detection models, composite boolean logic, and SLO burn-rate calculations -- against incoming metrics. The act layer routes alerts to the appropriate channels based on severity, team ownership, and on-call schedules, attaching contextual information and runbook links.
A critical design principle is separation of detection from notification. The rule engine should evaluate all rules continuously, but the notification layer should deduplicate, group, and throttle alerts before delivery. This prevents alert storms where a single root cause generates dozens of independent alerts. Prometheus Alertmanager, for example, provides built-in grouping, inhibition, and silencing that embody this principle.
Key Components
Metric Ingestion Layer
Collects metrics from multiple sources: Prometheus exporters for infrastructure metrics, custom ML metric exporters for prediction distributions and drift scores, APM tools for latency and error rates, and logging aggregators for error patterns. Normalizes all metrics into a consistent time-series format with labels for model name, version, environment, and region.
Metric Store (TSDB)
Stores time-series metric data with configurable retention (typically 15-90 days for hot storage). Prometheus, Cortex, or Thanos provide the storage backbone. Must support efficient range queries for anomaly detection lookback windows and downsampling for long-term trend analysis.
Rule Evaluation Engine
Continuously evaluates alerting rules against metric streams. Supports three rule types: static threshold rules (PromQL expressions), anomaly detection rules (statistical or ML-based), and composite rules (boolean combinations with temporal constraints). Evaluates rules at configurable intervals (typically 15s-60s for critical metrics, 5m-15m for slow-moving metrics like drift scores).
Alert Router and Deduplicator
Receives fired alerts from the rule engine, deduplicates them (same alert firing repeatedly should not generate new notifications), groups related alerts (multiple metrics from the same model degradation event), and routes to the appropriate notification channel based on severity and team ownership. Implements inhibition rules: if a P1 infrastructure alert is active, suppress P2 model quality alerts that are likely symptoms.
Notification Delivery
Delivers alerts through multiple channels: PagerDuty or Grafana OnCall for paging alerts (P1/P2), Slack or Microsoft Teams for warning alerts (P3), email digests for informational alerts (P4). Each notification includes: alert name, severity, affected model/service, current metric value vs threshold, trend sparkline, linked runbook URL, and escalation timeline.
Escalation Policy Engine
Manages escalation chains: if the primary on-call doesn't acknowledge within N minutes, escalate to secondary on-call, then to the team lead, then to engineering management. Integrates with on-call scheduling tools to determine who is currently on-call. Supports override schedules for holidays and planned leaves.
Runbook Registry
Maintains a catalog of runbooks (diagnostic and remediation playbooks) linked to specific alert types. Each runbook includes: description of the problem, diagnostic commands to run, decision tree for root cause analysis, remediation steps, and rollback procedures. Runbooks are version-controlled and reviewed during post-incident reviews.
Feedback and Tuning Loop
Tracks alert outcomes (was this alert actionable? did it lead to an incident? was it a false positive?) to continuously improve alert quality. Feeds into weekly or monthly alert quality reviews where noisy alerts are tuned, suppressed, or replaced. Maintains an alert-to-incident ratio dashboard that the team reviews regularly.
Data Flow
Metric Flow: Raw metrics are scraped or pushed from ML serving infrastructure at 15-second intervals -> stored in the time-series database with labels -> the rule engine queries the TSDB at each evaluation cycle.
Alert Flow: When a rule evaluates to true, a raw alert is emitted -> the router checks for deduplication (is this alert already active?) -> groups it with related alerts -> determines severity and routing -> delivers via the appropriate channel with full context.
Escalation Flow: After notification delivery, a timer starts -> if no acknowledgment within the escalation timeout (typically 5-15 minutes for P1), the alert escalates to the next level -> this continues up the chain until acknowledged or the maximum escalation level is reached.
Feedback Flow: After incident resolution, the on-call engineer tags the alert as true positive, false positive, or not actionable -> this data feeds into monthly alert quality reviews -> low-precision alerts are tuned or removed -> new alerts are added based on post-incident learnings.
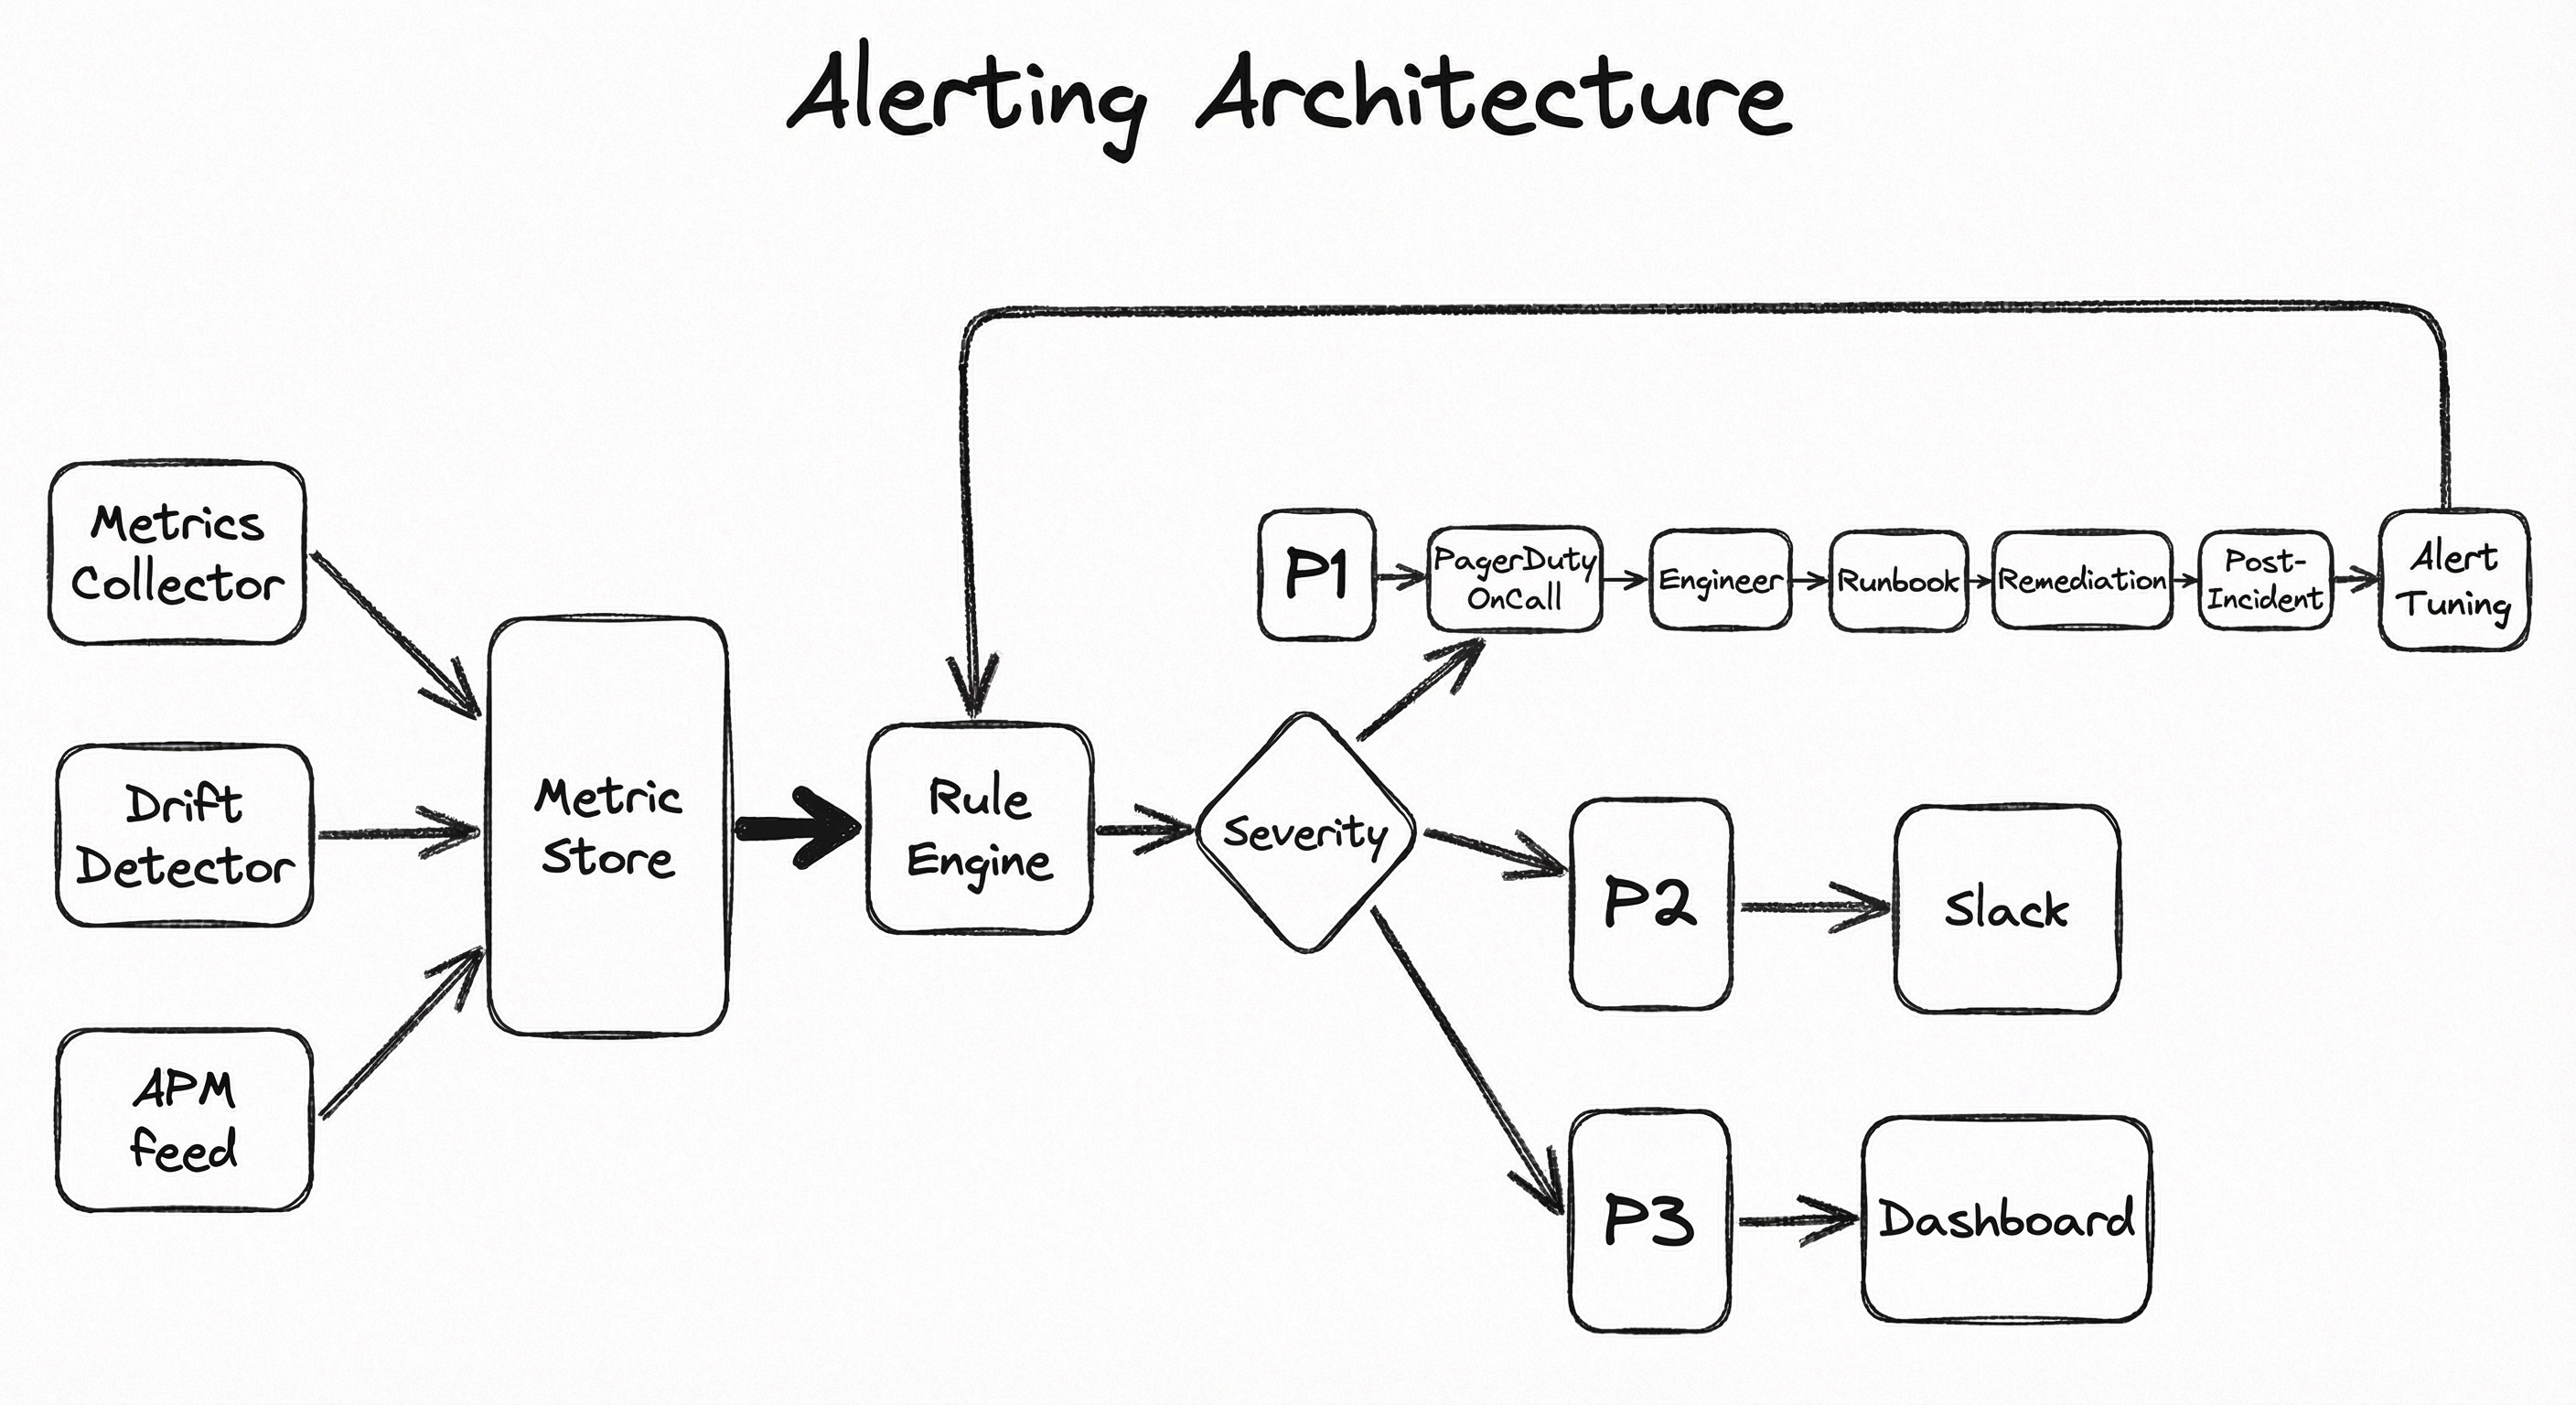
A directed flow diagram showing metric sources (Metrics Collector, Drift Detector, APM/Logging) feeding into a Metric Store, which feeds the Rule Engine. The Rule Engine branches by severity to three notification paths: PagerDuty/Grafana OnCall for critical, Slack for warnings, and Dashboard/Email for informational. The PagerDuty path continues to On-Call Engineer, then Runbook, then Remediation, then Post-Incident Review, which loops back to Alert Tuning and feeds into the Rule Engine, completing the feedback loop.
How to Implement
Implementation Approaches
Implementing ML alerting typically follows one of three strategies, depending on organizational maturity and scale:
Level 1: Prometheus + Alertmanager -- the most common starting point. You define PromQL-based alerting rules for infrastructure and basic ML metrics (latency, error rate, prediction count). Alertmanager handles grouping, deduplication, and routing to Slack or PagerDuty. This covers about 60% of what you need and is free. For a startup in Bengaluru running 5-10 ML models, this is likely sufficient.
Level 2: Prometheus + ML-specific monitoring tool -- add Evidently AI or a custom drift detection service that computes statistical tests on prediction distributions and feature values. These tools generate drift scores that Prometheus scrapes and evaluates with standard alerting rules. This adds coverage for the silent ML failures that pure infrastructure monitoring misses.
Level 3: Full observability platform -- use Arize AI, Fiddler, or a custom-built platform that combines infrastructure metrics, ML performance metrics, drift detection, and alerting in a unified system. These platforms offer pre-built monitors for common ML failure modes, automatic baseline learning, and integrated incident management. Monthly costs range from 10,000+ (~INR 8.4 lakh+) for enterprise scale.
Cost Comparison (India Context): A self-hosted Prometheus + Alertmanager + Grafana stack on a c5.xlarge EC2 instance in Mumbai (ap-south-1) costs approximately 500/month (~INR 42,000/month) but saves significant engineering effort.
Regardless of the approach, the key implementation decisions are: (1) what metrics to alert on, (2) what thresholds or baselines to use, (3) how to route alerts by severity, and (4) how to prevent alert fatigue through grouping, deduplication, and quality reviews.
# prometheus-alerts.yml
groups:
  - name: ml_model_alerts
    rules:
      # P1: Model serving latency exceeds SLO
      - alert: ModelLatencyP99High
        expr: |
          histogram_quantile(0.99,
            rate(ml_prediction_duration_seconds_bucket{job="model-server"}[5m])
          ) > 0.200
        for: 5m
        labels:
          severity: critical
          team: ml-platform
        annotations:
          summary: "Model {{ $labels.model_name }} P99 latency above 200ms"
          description: |
            P99 latency is {{ $value | humanizeDuration }} for model
            {{ $labels.model_name }} (version {{ $labels.model_version }}).
            This exceeds the 200ms SLO. Check for input size increase,
            resource contention, or model complexity regression.
          runbook_url: "https://wiki.internal/runbooks/model-latency-high"

      # P1: Prediction error rate burn rate too high
      - alert: PredictionErrorBurnRateHigh
        expr: |
          (
            sum(rate(ml_prediction_errors_total{job="model-server"}[1h]))
            /
            sum(rate(ml_predictions_total{job="model-server"}[1h]))
          ) / (1 - 0.999) > 14.4
        for: 2m
        labels:
          severity: critical
          team: ml-platform
        annotations:
          summary: "Error budget burn rate critical for model predictions"
          description: |
            The 1h burn rate is {{ $value }}x, indicating the monthly
            error budget (0.1%) will be exhausted in {{ 720 | humanize }}
            divided by {{ $value }} hours. Investigate immediately.
          runbook_url: "https://wiki.internal/runbooks/prediction-error-spike"

      # P2: Feature null rate anomaly
      - alert: FeatureNullRateHigh
        expr: |
          ml_feature_null_rate{job="feature-store"} > 0.05
          and
          ml_feature_null_rate{job="feature-store"}
            > 3 * avg_over_time(ml_feature_null_rate{job="feature-store"}[7d])
        for: 10m
        labels:
          severity: warning
          team: data-engineering
        annotations:
          summary: "Feature {{ $labels.feature_name }} null rate anomaly"
          description: |
            Null rate for feature {{ $labels.feature_name }} is {{ $value | humanizePercentage }},
            which is >3x the 7-day average. This may indicate an upstream
            data pipeline failure. Check the feature store ingestion pipeline.
          runbook_url: "https://wiki.internal/runbooks/feature-null-rate"

      # P2: Prediction distribution drift
      - alert: PredictionDistributionDrift
        expr: |
          ml_prediction_psi_score{job="drift-detector"} > 0.2
        for: 15m
        labels:
          severity: warning
          team: ml-engineering
        annotations:
          summary: "Prediction drift detected for {{ $labels.model_name }}"
          description: |
            PSI score is {{ $value }} (threshold 0.2) for model
            {{ $labels.model_name }}. This indicates significant
            distributional shift in predictions vs training baseline.
          runbook_url: "https://wiki.internal/runbooks/prediction-drift"
This Prometheus alerting rules file demonstrates four key ML-specific alerts. The first uses histogram quantiles for latency SLO monitoring. The second implements Google SRE-style burn rate alerting for error budgets -- a burn rate of 14.4 means the monthly error budget would be consumed in roughly 2 days, which warrants immediate investigation. The third combines an absolute threshold with a relative comparison to the 7-day average, reducing false positives from seasonal patterns. The fourth monitors the Population Stability Index (PSI) for prediction distribution drift.
# alertmanager.yml
global:
  resolve_timeout: 5m
  pagerduty_url: 'https://events.pagerduty.com/v2/enqueue'
  slack_api_url: 'https://hooks.slack.com/services/T00000000/B00000000/XXXXXXXX'

templates:
  - '/etc/alertmanager/templates/*.tmpl'

route:
  receiver: 'slack-ml-alerts'
  group_by: ['alertname', 'model_name']
  group_wait: 30s
  group_interval: 5m
  repeat_interval: 4h
  routes:
    # P1 Critical: Page on-call via PagerDuty
    - match:
        severity: critical
      receiver: 'pagerduty-ml-critical'
      group_wait: 10s
      repeat_interval: 30m
      continue: true

    # P2 Warning: Slack + ticket
    - match:
        severity: warning
      receiver: 'slack-ml-warnings'
      group_wait: 1m
      repeat_interval: 2h

    # Inhibition: suppress model quality alerts during infra outages
inhibit_rules:
  - source_match:
      alertname: 'ModelServerDown'
    target_match_re:
      alertname: 'Prediction.*|Feature.*'
    equal: ['model_name']

receivers:
  - name: 'pagerduty-ml-critical'
    pagerduty_configs:
      - service_key: '<PD_SERVICE_KEY>'
        severity: 'critical'
        description: '{{ .GroupLabels.alertname }}: {{ .CommonAnnotations.summary }}'
        details:
          model: '{{ .GroupLabels.model_name }}'
          runbook: '{{ .CommonAnnotations.runbook_url }}'
          firing: '{{ .Alerts.Firing | len }}'

  - name: 'slack-ml-warnings'
    slack_configs:
      - channel: '#ml-alerts-warnings'
        title: '{{ .GroupLabels.alertname }}'
        text: '{{ .CommonAnnotations.description }}'
        actions:
          - type: button
            text: 'Runbook'
            url: '{{ .CommonAnnotations.runbook_url }}'
          - type: button
            text: 'Dashboard'
            url: 'https://grafana.internal/d/ml-models'

  - name: 'slack-ml-alerts'
    slack_configs:
      - channel: '#ml-alerts-info'
        title: '{{ .GroupLabels.alertname }}'
        text: '{{ .CommonAnnotations.summary }}'
This Alertmanager configuration demonstrates three essential patterns: (1) severity-based routing where P1 alerts page via PagerDuty while P2 alerts go to Slack, (2) alert grouping by alertname and model_name so multiple metrics from the same model degradation event produce a single notification rather than a storm, and (3) inhibition rules that suppress model quality alerts when the model server itself is down -- because obviously prediction drift is expected when the server is offline. The group_wait, group_interval, and repeat_interval settings control alert batching to prevent notification floods.
import numpy as np
from prometheus_client import (
    Histogram, Counter, Gauge, Info, start_http_server
)
from scipy import stats
from collections import deque
from dataclasses import dataclass, field
from typing import Optional
import time


@dataclass
class AnomalyDetector:
    """Rolling z-score anomaly detector for ML metrics."""
    window_size: int = 1000
    z_threshold: float = 3.0
    _buffer: deque = field(default_factory=lambda: deque(maxlen=1000))

    def __post_init__(self):
        self._buffer = deque(maxlen=self.window_size)

    def observe(self, value: float) -> Optional[float]:
        """Add observation. Returns z-score if anomalous, None otherwise."""
        self._buffer.append(value)
        if len(self._buffer) < 100:  # need minimum data
            return None
        arr = np.array(self._buffer)
        mu, sigma = arr.mean(), arr.std()
        if sigma < 1e-10:  # avoid div by zero
            return None
        z = abs(value - mu) / sigma
        return z if z > self.z_threshold else None


# Prometheus metrics
PREDICTION_LATENCY = Histogram(
    'ml_prediction_duration_seconds',
    'Time to generate a prediction',
    ['model_name', 'model_version'],
    buckets=[0.01, 0.025, 0.05, 0.1, 0.2, 0.5, 1.0, 2.5]
)
PREDICTION_COUNT = Counter(
    'ml_predictions_total',
    'Total predictions served',
    ['model_name', 'model_version', 'status']
)
PREDICTION_ERROR_COUNT = Counter(
    'ml_prediction_errors_total',
    'Total prediction errors',
    ['model_name', 'model_version', 'error_type']
)
PREDICTION_SCORE = Histogram(
    'ml_prediction_score',
    'Distribution of prediction scores/probabilities',
    ['model_name', 'model_version'],
    buckets=[0.0, 0.1, 0.2, 0.3, 0.4, 0.5, 0.6, 0.7, 0.8, 0.9, 1.0]
)
FEATURE_NULL_RATE = Gauge(
    'ml_feature_null_rate',
    'Rate of null values per feature',
    ['model_name', 'feature_name']
)
PREDICTION_DRIFT_PSI = Gauge(
    'ml_prediction_psi_score',
    'Population Stability Index for prediction drift',
    ['model_name', 'model_version']
)
ANOMALY_SCORE = Gauge(
    'ml_metric_anomaly_zscore',
    'Z-score of latest metric observation (0 if normal)',
    ['model_name', 'metric_name']
)


def compute_psi(expected: np.ndarray, actual: np.ndarray,
                bins: int = 10) -> float:
    """Compute Population Stability Index between two distributions."""
    eps = 1e-4
    breakpoints = np.linspace(min(expected.min(), actual.min()),
                              max(expected.max(), actual.max()),
                              bins + 1)
    expected_pct = np.histogram(expected, breakpoints)[0] / len(expected) + eps
    actual_pct = np.histogram(actual, breakpoints)[0] / len(actual) + eps
    psi = np.sum((actual_pct - expected_pct) * np.log(actual_pct / expected_pct))
    return float(psi)


class MLMetricExporter:
    """Exports ML model metrics for Prometheus scraping with anomaly detection."""

    def __init__(self, model_name: str, model_version: str):
        self.model_name = model_name
        self.model_version = model_version
        self.latency_detector = AnomalyDetector(window_size=5000, z_threshold=3.5)
        self.score_detector = AnomalyDetector(window_size=5000, z_threshold=3.0)
        self._reference_scores: Optional[np.ndarray] = None
        self._recent_scores: deque = deque(maxlen=10000)

    def set_reference_distribution(self, scores: np.ndarray):
        """Set the reference prediction distribution for PSI computation."""
        self._reference_scores = scores

    def record_prediction(self, latency_s: float, score: float,
                          features: dict, status: str = 'success'):
        """Record a single prediction event."""
        labels = [self.model_name, self.model_version]

        # Core metrics
        PREDICTION_LATENCY.labels(*labels).observe(latency_s)
        PREDICTION_COUNT.labels(*labels, status).inc()
        PREDICTION_SCORE.labels(*labels).observe(score)

        # Anomaly detection on latency
        z = self.latency_detector.observe(latency_s)
        ANOMALY_SCORE.labels(self.model_name, 'latency').set(
            z if z else 0.0
        )

        # Anomaly detection on prediction score
        z = self.score_detector.observe(score)
        ANOMALY_SCORE.labels(self.model_name, 'prediction_score').set(
            z if z else 0.0
        )

        # Feature null rate monitoring
        for feat_name, feat_val in features.items():
            if feat_val is None or (isinstance(feat_val, float)
                                    and np.isnan(feat_val)):
                # Increment null counter (simplified; production would
                # use a sliding window rate)
                FEATURE_NULL_RATE.labels(
                    self.model_name, feat_name
                ).inc(0.001)  # exponential moving average approximation

        # PSI drift computation (every 1000 predictions)
        self._recent_scores.append(score)
        if (self._reference_scores is not None
                and len(self._recent_scores) >= 1000
                and len(self._recent_scores) % 1000 == 0):
            psi = compute_psi(
                self._reference_scores,
                np.array(self._recent_scores)
            )
            PREDICTION_DRIFT_PSI.labels(*labels).set(psi)

    def record_error(self, error_type: str):
        """Record a prediction error."""
        PREDICTION_ERROR_COUNT.labels(
            self.model_name, self.model_version, error_type
        ).inc()


# Usage
if __name__ == '__main__':
    start_http_server(9091)  # Prometheus scrape endpoint
    exporter = MLMetricExporter('fraud-detector', 'v2.3.1')

    # Set reference from training distribution
    exporter.set_reference_distribution(
        np.random.beta(2, 5, size=50000)  # placeholder; use real data
    )

    # Simulate predictions
    while True:
        latency = np.random.exponential(0.05)
        score = np.random.beta(2, 5)
        features = {'amount': 1500.0, 'merchant_category': 'electronics',
                    'user_age_days': None}  # simulated null
        exporter.record_prediction(latency, score, features)
        time.sleep(0.01)
This Python module creates a complete ML metric exporter that instruments a model serving application for Prometheus scraping. It exports five key metric types: prediction latency (histogram), prediction count (counter), error count (counter), prediction score distribution (histogram), and feature null rate (gauge). The AnomalyDetector class implements a rolling z-score anomaly detector that runs inline with each prediction, exposing z-scores as a Prometheus gauge. The compute_psi function calculates the Population Stability Index between the training-time reference distribution and the live prediction distribution, enabling the drift alerting rules from the first code example.
import requests
import json
from datetime import datetime, timezone
from typing import Optional
from dataclasses import dataclass


@dataclass
class MLAlertPayload:
    """Structured alert payload for ML model incidents."""
    model_name: str
    model_version: str
    alert_name: str
    severity: str  # 'critical', 'error', 'warning', 'info'
    metric_name: str
    current_value: float
    threshold: float
    description: str
    runbook_url: str
    dashboard_url: str
    environment: str = 'production'
    region: str = 'ap-south-1'  # Mumbai


def send_pagerduty_alert(
    routing_key: str,
    payload: MLAlertPayload,
    dedup_key: Optional[str] = None
) -> dict:
    """Send a structured ML alert to PagerDuty Events API v2."""
    if dedup_key is None:
        dedup_key = f"{payload.model_name}-{payload.alert_name}-{payload.environment}"

    pd_payload = {
        "routing_key": routing_key,
        "dedup_key": dedup_key,
        "event_action": "trigger",
        "payload": {
            "summary": (
                f"[{payload.severity.upper()}] {payload.alert_name}: "
                f"{payload.model_name} ({payload.model_version}) - "
                f"{payload.metric_name}={payload.current_value:.4f} "
                f"(threshold: {payload.threshold:.4f})"
            ),
            "source": f"ml-alerting-{payload.environment}",
            "severity": payload.severity,
            "timestamp": datetime.now(timezone.utc).isoformat(),
            "component": payload.model_name,
            "group": "ml-models",
            "class": payload.alert_name,
            "custom_details": {
                "model_name": payload.model_name,
                "model_version": payload.model_version,
                "metric_name": payload.metric_name,
                "current_value": payload.current_value,
                "threshold": payload.threshold,
                "environment": payload.environment,
                "region": payload.region,
                "description": payload.description,
                "runbook_url": payload.runbook_url,
                "dashboard_url": payload.dashboard_url,
            },
        },
        "links": [
            {"href": payload.runbook_url, "text": "Runbook"},
            {"href": payload.dashboard_url, "text": "Grafana Dashboard"},
        ],
    }

    resp = requests.post(
        "https://events.pagerduty.com/v2/enqueue",
        json=pd_payload,
        headers={"Content-Type": "application/json"},
        timeout=10,
    )
    resp.raise_for_status()
    return resp.json()


def resolve_pagerduty_alert(routing_key: str, dedup_key: str) -> dict:
    """Auto-resolve a PagerDuty alert when the condition clears."""
    pd_payload = {
        "routing_key": routing_key,
        "dedup_key": dedup_key,
        "event_action": "resolve",
    }
    resp = requests.post(
        "https://events.pagerduty.com/v2/enqueue",
        json=pd_payload,
        headers={"Content-Type": "application/json"},
        timeout=10,
    )
    resp.raise_for_status()
    return resp.json()


# Usage example
if __name__ == '__main__':
    PD_ROUTING_KEY = 'your-pagerduty-integration-key'

    alert = MLAlertPayload(
        model_name='fraud-detector',
        model_version='v2.3.1',
        alert_name='PredictionDistributionDrift',
        severity='warning',
        metric_name='psi_score',
        current_value=0.35,
        threshold=0.20,
        description=(
            'PSI score 0.35 indicates significant drift in fraud '
            'detection model predictions. Possible causes: upstream '
            'feature pipeline change, new merchant category, or '
            'seasonal transaction pattern shift (e.g., Diwali sale).'
        ),
        runbook_url='https://wiki.internal/runbooks/prediction-drift',
        dashboard_url='https://grafana.internal/d/fraud-model-v2',
        region='ap-south-1',
    )

    result = send_pagerduty_alert(PD_ROUTING_KEY, alert)
    print(f"Alert sent: {result['dedup_key']}")
This module demonstrates how to send richly contextual ML alerts to PagerDuty's Events API v2. The MLAlertPayload dataclass standardizes the information every alert carries: model name, version, the specific metric and its current value versus threshold, a human-readable description, and links to the runbook and dashboard. The dedup_key ensures that the same alert condition firing repeatedly doesn't create duplicate incidents. The resolve_pagerduty_alert function automatically closes the PagerDuty incident when the metric returns to normal -- essential for preventing stale incidents from cluttering the on-call engineer's queue.
# Escalation policy example (PagerDuty-style YAML)
escalation_policy:
  name: ml-platform-escalation
  description: Escalation for ML model serving alerts
  repeat_enabled: true
  num_loops: 3  # repeat entire chain 3 times before stopping
  rules:
    - escalation_delay_in_minutes: 5
      targets:
        - type: schedule_reference
          id: ML_PRIMARY_ONCALL  # Primary on-call schedule
    - escalation_delay_in_minutes: 10
      targets:
        - type: schedule_reference
          id: ML_SECONDARY_ONCALL  # Secondary on-call
    - escalation_delay_in_minutes: 15
      targets:
        - type: user_reference
          id: ML_TEAM_LEAD  # Team lead
    - escalation_delay_in_minutes: 30
      targets:
        - type: user_reference
          id: ENGINEERING_MANAGER  # Engineering manager

# On-call rotation schedule
oncall_schedule:
  name: ml-platform-primary
  timezone: Asia/Kolkata
  rotation:
    type: weekly
    handoff_time: "09:00"  # IST morning handoff
    handoff_day: Monday
    members:
      - [email protected]
      - [email protected]
      - [email protected]
      - [email protected]
  overrides:
    - start: "2026-01-26"  # Republic Day
      end: "2026-01-27"
      user: [email protected]
Common Implementation Mistakes
- ●
Alerting on every metric independently: Setting up 50 separate alerts for 50 metrics produces an unmanageable alert storm when a single root cause affects multiple metrics simultaneously. Instead, use composite alerts and Alertmanager grouping to correlate related signals.
- ●
Using the same threshold for all environments: A prediction latency threshold of 200ms might be appropriate for production but will constantly fire in staging where instances are smaller. Always parameterize thresholds by environment.
- ●
Missing the
forclause in Prometheus alerts: Omitting theforduration causes alerts to fire on transient spikes. A model might briefly exceed the latency threshold during a garbage collection pause -- that's not worth paging someone at 3 AM. Usefor: 5mor longer for non-catastrophic alerts. - ●
No deduplication key strategy: Without consistent dedup keys, the same incident generates multiple PagerDuty incidents. Use a combination of model name, alert name, and environment as the dedup key.
- ●
Alerting on raw drift scores without business impact correlation: A PSI score of 0.25 might mean nothing if the downstream business metric (conversion rate, approval rate) is stable. Always validate that your drift thresholds correspond to actual performance degradation before promoting them to paging alerts.
- ●
Never reviewing or retiring alerts: Alerts accumulate over time as the system evolves. Rules written for model v1 may be irrelevant for model v5. Schedule monthly alert hygiene reviews where the team asks: 'Did this alert fire last month? Was it actionable? Should the threshold change?'
- ●
Paging on warnings: Not every alert should wake someone up. Reserve paging (P1) for conditions that directly impact users or revenue. Drift detection and gradual degradation should be P2/P3 alerts that the team triages during business hours.
When Should You Use This?
Use When
You have ML models serving production traffic where silent degradation could impact business metrics (revenue, user experience, safety)
Your models depend on upstream data pipelines that can fail or drift without obvious errors
Regulatory or compliance requirements mandate continuous monitoring of model performance (e.g., RBI guidelines for credit scoring models in India)
Your team has grown beyond 2-3 engineers and needs formal on-call rotation with escalation policies
You are operating models across multiple environments (staging, production, canary) and need environment-specific alert thresholds
Business stakeholders report model quality issues before your engineering team notices -- a clear sign you need proactive alerting
You are running A/B tests or canary deployments and need automated rollback triggers based on model performance metrics
Avoid When
Your model is a batch-only job with human review of results before any business action -- manual inspection may suffice with simple job success/failure notifications
You have a single model in early experimentation with no production traffic yet -- focus on building evaluation pipelines first, alerting comes later
Your team is too small (1-2 people) to sustain on-call rotation -- in this case, simple Slack notifications during business hours are more realistic than a full PagerDuty setup
The model's predictions are advisory only with no automated downstream actions -- the blast radius of model degradation is limited, so lighter-weight monitoring may suffice
You haven't established baseline metrics for what 'normal' looks like -- without baselines, thresholds are guesses and anomaly detection has no reference. Build monitoring dashboards first, then add alerting once you understand normal behavior
Your organization lacks incident response processes -- adding alerts without runbooks and escalation policies just creates noise. Build the response infrastructure before turning on the fire alarm
Key Tradeoffs
The Fundamental Tradeoff: Sensitivity vs. Noise
Every alerting system lives on a precision-recall curve. High sensitivity (low thresholds, aggressive anomaly detection) catches real problems faster but generates more false positives. High precision (conservative thresholds, composite rules) reduces noise but risks missing early-stage degradation.
The right operating point depends on the cost of missed detection vs. the cost of false alarms. For a fraud detection model at Razorpay, a missed alert could mean lakhs of rupees in fraud losses. For a content recommendation model at an entertainment app, a few hours of slightly-off recommendations is annoying but not catastrophic. Calibrate your alerting sensitivity to the business impact of the model.
| Dimension | Aggressive Alerting | Conservative Alerting |
|---|---|---|
| False positive rate | High (10-30%) | Low (<5%) |
| Time to detect real issues | Minutes | Hours to days |
| On-call burden | Heavy -- risk of burnout | Manageable |
| Suitable for | Safety-critical, financial, healthcare ML | Content recommendations, internal tools |
| Alert-to-incident ratio | 5:1 to 10:1 | 1.5:1 to 3:1 |
Static Thresholds vs. Dynamic Baselines
Static thresholds are simple and predictable but require manual tuning and can't adapt to seasonal patterns. Dynamic baselines (learned from historical data) adapt automatically but add complexity and can produce confusing alerts when the baseline itself shifts.
A pragmatic approach: use static thresholds for hard limits (latency SLOs, error rate caps) and dynamic baselines for distributional metrics (prediction score distributions, feature value ranges, traffic patterns).
Self-Hosted vs. Managed
Self-hosted Prometheus + Alertmanager gives maximum flexibility and zero licensing cost but requires operational investment. Managed platforms (Arize, Fiddler, Datadog ML Monitoring) provide pre-built monitors and integrations but come with monthly costs that scale with data volume. For an Indian startup watching costs, a self-hosted stack on a $125/month (~INR 10,500/month) VM is often the right starting point, upgrading to managed services once the team and model portfolio grow.
Alternatives & Comparisons
A metrics collector gathers and stores metrics but doesn't evaluate rules or send notifications. It's the data layer that alerting builds upon. If you only need dashboards for manual observation (e.g., during early-stage model development), a metrics collector alone may suffice. Add alerting when you need proactive, automated notification of problems.
Drift detection identifies distributional shifts in features and predictions but doesn't inherently notify anyone or manage incidents. It's a signal source that feeds into the alerting system. Use standalone drift detection when you want to log drift for analysis; add alerting when you need real-time notification and incident response for detected drift.
APM tools (Datadog, New Relic, Dynatrace) excel at infrastructure and application-level monitoring -- latency, error rates, throughput, resource utilization. They catch model server failures but miss ML-specific degradation like accuracy drops and prediction drift. Use APM for infrastructure alerting; add ML-specific alerting for model quality monitoring.
Log-based alerting (ELK stack, Loki + Grafana) can detect error patterns and specific log messages but struggles with numerical metric analysis and statistical drift detection. Use log-based alerts for catching known error patterns; use metric-based alerting for continuous performance monitoring and anomaly detection.
Pros, Cons & Tradeoffs
Advantages
Reduces Mean Time to Detect (MTTD) from hours/days (human discovery) to minutes (automated detection). For a model serving millions of predictions per day at Flipkart or Swiggy, even a 1-hour faster detection can prevent significant business impact.
Prevents alert fatigue through intelligent grouping -- modern alerting tools (Alertmanager, PagerDuty) group related alerts into single incidents, reducing the 4,484 average daily alerts that SOC teams face down to a manageable set of actionable notifications.
Enables formal incident response processes with escalation policies, on-call rotations, and runbooks. This transforms model operations from ad-hoc firefighting into a disciplined SRE practice.
SLO-based burn rate alerting aligns engineering effort with business objectives. Instead of alerting on arbitrary thresholds, teams alert on error budget consumption rates, ensuring they page only when the business SLO is genuinely at risk.
Composite alerts dramatically reduce false positives by requiring multiple correlated signals before firing. A drift alert alone might be a 50% false positive; drift AND accuracy drop AND feature null rate increase together is almost certainly a real incident.
Auto-resolution clears the noise -- when the condition clears, the alert resolves automatically. This prevents stale incidents from accumulating in PagerDuty and reduces cognitive load on the on-call engineer.
Runbook integration accelerates remediation by providing step-by-step diagnosis and resolution guidance directly linked to each alert. A new on-call engineer can effectively respond to incidents they've never seen before.
Disadvantages
Alert fatigue is the default state -- without careful tuning, alerting systems produce far more noise than signal. The median team experiences an alert-to-incident ratio of 5:1 or higher, meaning 80% of alerts are false positives or non-actionable.
Threshold calibration requires domain expertise -- setting the right PSI threshold for drift, the right latency percentile for SLO monitoring, or the right z-score for anomaly detection requires deep understanding of both the model and the business context. There's no universal default.
Operational overhead of on-call rotation is significant. An ML engineering team of 4-5 people doing weekly rotation means each engineer is on-call 20-25% of the time, which impacts productivity and morale if alert quality is poor.
Dynamic baselines can produce confusing alerts when the baseline itself shifts (e.g., a legitimate seasonal change in traffic patterns). Engineers waste time investigating "anomalies" that are actually expected behavior during events like Diwali sales or IPL season.
Integration complexity across tools -- connecting Prometheus, Alertmanager, PagerDuty, Slack, and runbook systems requires non-trivial configuration and maintenance. Each integration is a potential point of failure in the alerting pipeline itself.
Cost scales with metric volume -- managed alerting platforms charge per metric series or per alert evaluation. For a platform with 100 ML models, each exporting 50 metrics, monitoring costs can reach $2,000-5,000/month (~INR 1.7-4.2 lakh/month) on managed platforms.
Failure Modes & Debugging
Alert fatigue leading to ignored critical alerts
Cause
Too many low-quality alerts desensitize the on-call engineer. Common causes: overly sensitive thresholds, no deduplication, independent alerts for correlated metrics, and failure to retire stale alert rules. Research shows SOC teams ignore 67% of alerts due to fatigue.
Symptoms
P1 alerts are not acknowledged within the escalation timeout. On-call engineers configure 'do not disturb' modes. Alert acknowledgment time steadily increases over weeks. Post-incident reviews reveal the alert fired but was buried in noise.
Mitigation
Implement a monthly alert hygiene review: for each alert that fired, tag it as true positive, false positive, or non-actionable. Set a target alert precision of >80%. Use composite alerts to require multiple correlated signals. Implement aggressive grouping in Alertmanager. Track and dashboard the alert-to-incident ratio. Remove any alert that hasn't produced a true positive in 90 days.
Silent model degradation (missed alert)
Cause
Alert thresholds are too conservative, critical metrics are not monitored, or the degradation pattern doesn't match any existing alert rule. Common with novel failure modes like a new type of data drift or an upstream schema change that produces valid but semantically different values.
Symptoms
Business stakeholders report model quality issues (e.g., 'recommendation quality feels off this week') before the engineering team is aware. Business metrics (CTR, conversion rate, approval rate) decline without any alert firing.
Mitigation
Implement canary alerting with separate thresholds for canary vs. production traffic. Add broad anomaly detection on prediction distributions as a catch-all. Schedule regular proactive reviews of model evaluation metrics (weekly or bi-weekly). After every missed-alert incident, add a new alert rule via post-incident review and track the 'alert coverage' metric.
Alerting pipeline itself fails silently
Cause
The Prometheus scraper stops collecting metrics, the Alertmanager process crashes, the PagerDuty integration key expires, or the Slack webhook URL changes. The monitoring system is supposed to watch other systems, but who watches the monitoring system?
Symptoms
No alerts fire for an extended period (suspiciously quiet). The Alertmanager 'alerts firing' metric drops to zero. A production incident occurs with no corresponding alert.
Mitigation
Implement dead man's switch (also called 'watchdog') alerts. Configure a heartbeat alert that fires constantly and sends to a dedicated channel. If the heartbeat stops, the external monitoring service (e.g., PagerDuty's heartbeat check, Better Uptime, or Healthchecks.io) detects the silence and pages the team. This costs ~$10/month (~INR 840/month) and catches monitoring-of-monitoring failures.
Escalation chain breaks during incident
Cause
On-call schedule is out of date (engineer left the team, schedule not updated), the secondary on-call is unreachable (phone on airplane mode, contact info outdated), or the escalation policy has wrong timeouts (too long, allowing the incident to compound).
Symptoms
Alert fired but nobody responded. The incident was only discovered hours later when a downstream team or customer reported the problem. Post-incident timeline shows a gap between alert fire time and first human response.
Mitigation
Automate on-call schedule management with PagerDuty or Grafana OnCall -- integrate with HR systems for departures and team changes. Test the escalation chain monthly with a drill (like a fire drill). Keep escalation timeouts short (5 minutes for P1). Require on-call engineers to acknowledge a 'start of shift' notification to confirm reachability.
Threshold drift over time
Cause
The model and its operating environment evolve, but alert thresholds remain static. A latency threshold set when the model was small becomes meaningless after the model is upgraded to a larger architecture. A drift threshold calibrated on the original data distribution becomes too sensitive or too lax as the data distribution naturally shifts.
Symptoms
Gradual increase in false positive rate (threshold too tight) or gradual decrease in detection rate (threshold too loose). Alert precision degrades quarter-over-quarter.
Mitigation
Implement adaptive thresholds that recalculate based on rolling historical windows (e.g., 90th percentile of the past 30 days). For static thresholds, schedule quarterly recalibration tied to model retraining cycles. Track threshold effectiveness in post-incident reviews.
Alert storm during cascading failure
Cause
A single root cause (e.g., upstream database outage) triggers dozens of downstream alerts simultaneously: feature null rates spike, prediction latency increases, error rates climb, drift scores jump. Without proper grouping and inhibition, the on-call engineer receives 50+ notifications in 5 minutes.
Symptoms
On-call engineer's phone buzzes continuously for several minutes. PagerDuty shows 20+ separate incidents for the same root cause. Engineer struggles to identify the root cause because it's buried in noise.
Mitigation
Configure inhibition rules in Alertmanager: when a high-level infrastructure alert fires (e.g., database down), suppress dependent model quality alerts. Implement alert grouping by model name and failure category. Set appropriate group_wait intervals (30s-60s) to batch related alerts. Use root cause analysis (RCA) tags in alert payloads to link related alerts.
Placement in an ML System
Where Alerting Fits in the ML System
The alerting system sits at the action boundary of the monitoring stack. Upstream, metrics collectors gather raw telemetry, drift detectors compute distributional statistics, logging systems aggregate errors and events, and APM tools track infrastructure health. All of these produce data. The alerting system is where that data crosses the threshold from passive observation to active response.
Downstream, the alerting system triggers three types of actions: (1) human response through on-call paging and escalation, (2) automated remediation such as auto-rollback to a previous model version when error rates spike, and (3) business notification to stakeholders who need to know about model quality changes that might affect their metrics.
In a mature ML platform (think Uber's Michelangelo or a well-built internal platform at a company like Zerodha), the alerting system is integrated into the CI/CD pipeline. Canary deployments automatically monitor alert status during the rollout window, and if any P1 or P2 alert fires, the deployment is automatically rolled back. This 'alerting as deployment gate' pattern is one of the most valuable integrations you can build.
Key Principle: Alerting is the bridge between observability and operations. Without alerting, observability is passive. Without observability, alerting is blind. Both must evolve together.
Pipeline Stage
Monitoring / Observability
Upstream
- metrics-collector
- drift-detection
- logging
- apm
Downstream
- incident-management
- auto-remediation
- model-rollback
Scaling Bottlenecks
The primary scaling bottleneck is rule evaluation throughput. Each alerting rule is a query against the time-series database, and query complexity grows with the number of metric series and the lookback window size. A typical production setup with 100 models, 50 metrics each, and 20 alerting rules per model means 2,000 rule evaluations per cycle. At a 15-second evaluation interval, that's 133 evaluations per second against Prometheus.
For most deployments up to ~500 models, a single Prometheus instance with Alertmanager handles the load. Beyond that, you need federated Prometheus with Thanos or Cortex for aggregation, or a managed solution like Grafana Cloud or Datadog.
The second bottleneck is notification delivery. PagerDuty's Events API has rate limits (typically 120 events per minute per integration key). During an alert storm, these limits can delay critical notifications. Mitigation: use separate integration keys for different severity levels, and implement client-side rate limiting with priority queues.
A concrete number: a well-tuned alerting system for 50 ML models should generate fewer than 100 alerts per week, of which 80+ should be actionable. If your numbers are significantly higher, you have a tuning problem, not a scaling problem.
Production Case Studies
Uber built Hue, an ML observability system within the Michelangelo platform, that tracks both operational metrics (availability, latency, throughput) and prediction-level indicators (score distributions, calibration, entropy). Feature health checks run in real time, tracking null rates, detecting drift via statistical tests, and verifying online-offline feature parity. Deployments start with a small traffic slice, with continuous monitoring and auto-rollback if error rates, latency, or CPU/GPU utilization breach thresholds. The system supports slicing by region, caller, or custom dimensions for precise debugging.
Hue detects prediction drift and surfaces anomalies within minutes, tightening CI/CD gates and enabling Uber to safely deploy model updates across 10,000+ ML models in production. Auto-rollback has prevented numerous degradation incidents during peak traffic periods.
Uber's broader alerting ecosystem processes metrics from tens of thousands of services. Their anomaly detection platform uses recurrent neural networks and feature extraction techniques to learn metric patterns, with alerting thresholds constantly adjusted without human intervention. This approach has been particularly effective for ML model metrics where seasonal patterns (rush hours, weekends, holidays, events) make static thresholds impractical.
The ML-powered alerting system reduced false positive rates by over 50% compared to static threshold alerting, while maintaining detection of critical incidents during unplanned events that cause unexpected demand spikes.
Monte Carlo built a data observability platform that applies ML-powered anomaly detection across five pillars of data health: freshness, volume, schema, distribution, and lineage. The system automatically learns baselines without manual threshold configuration and alerts data teams when anomalies are detected. Prefect, a workflow orchestration company, adopted Monte Carlo and recovered 20+ hours per week in engineering time previously spent on manual data quality triage.
Customers reported 50% reduction in time to detect data quality issues and 20+ hours per week of engineering productivity recovered. The ML-based anomaly detection approach eliminated the need for manual threshold configuration across thousands of data assets.
Google's SRE team pioneered SLO-based burn rate alerting, documented in the SRE Workbook. Instead of alerting on raw metrics, they define Service Level Objectives and alert when the error budget burn rate indicates the SLO will be breached. For ML serving systems, this means alerting not on every latency spike but only when the rate of SLO violations threatens to exhaust the monthly error budget. The approach uses multi-window alerting: a fast 1-hour window for severe burns (page immediately) and a slow 3-day window for gradual degradation (create a ticket).
Google reported that SLO-based alerting reduced paging alert volume by over 90% compared to threshold-based alerting while maintaining or improving incident detection rates. The approach has been widely adopted across the industry through the SRE book and workbook.
Backblaze, a cloud storage provider managing 2+ million hard drives, built an ML-based predictive alerting system to detect drives likely to fail before data loss occurs. Using SMART (Self-Monitoring, Analysis, and Reporting Technology) attributes collected daily from every drive, they trained gradient-boosted classifiers to predict failure probability. The challenge: extreme class imbalance with only ~1.5% annual failure rate across the fleet (2021).
The predictive alert system catches 85%+ of drive failures before they occur, with alerts triggered days to weeks in advance. This enables proactive drive replacement, reducing data recovery incidents and maintaining their 99.999% data durability guarantee across petabytes of customer data.
Tooling & Ecosystem
The industry-standard open-source monitoring and alerting stack. Prometheus collects and stores metrics; Alertmanager handles alert routing, grouping, deduplication, and notification delivery. Supports PromQL for flexible alert rule definition. The foundation of most ML alerting systems.
Enterprise incident management platform with ML-powered alert grouping, intelligent noise reduction, escalation policies, on-call scheduling, and runbook integration. Uses machine learning to recommend fixes from previously resolved incidents. The de facto standard for paging in production ML systems.
On-call management and incident response tool deeply integrated with the Grafana ecosystem. Supports alert grouping, escalation chains, on-call schedules, and multi-channel notification (Slack, phone, SMS, email). The cloud version (IRM) starts at 20/user. Note: the OSS version entered maintenance mode in March 2025.
Open-source ML and LLM observability framework with 100+ built-in evaluation metrics. Generates data drift reports, model performance dashboards, and integrates with Prometheus for metric export and alerting. Particularly strong for tabular ML models and NLP/LLM systems. Apache 2.0 license.
Post-deployment ML monitoring library specializing in performance estimation without ground truth labels using techniques like CBPE (Confidence-Based Performance Estimation). Pinpoints the exact timing of model performance shifts and reduces false positive alerts by focusing on meaningful changes. Best for tabular classification and regression models.
ML observability platform with native integrations for PagerDuty and OpsGenie. Provides pre-built monitors for drift, performance degradation, and data quality, with automated baseline learning and anomaly detection. Tailors alerts to specific model dimensions and sends comprehensive metadata for incident debugging.
Open-source visualization platform with built-in alerting capabilities. Supports multi-condition alerts, notification policies with severity-based routing, and contact points for Slack, PagerDuty, email, and webhooks. When combined with Prometheus as a data source, it provides a complete monitoring-to-alerting pipeline.
Incident management platform that combines uptime monitoring, on-call scheduling, and status pages. Useful as a dead-man's-switch monitor for your alerting pipeline itself -- it detects when your Prometheus/Alertmanager stops sending heartbeats. Competitive pricing starting at $25/month (~INR 2,100/month).
Research & References
Sculley, Holt, Golovin, Davydov, Phillips, Ebner, Chaudhary, Young, Crespo, Dennison (2015)NeurIPS 2015
The foundational paper identifying monitoring and alerting as a critical yet under-invested area in production ML systems. Argues that comprehensive live monitoring with automated response is essential for long-term system reliability, and that ML systems incur massive ongoing maintenance costs without it.
Choi, Lim, et al. (2024)ACM Computing Surveys, 2024
Comprehensive survey of deep learning approaches for time-series anomaly detection, covering autoencoders, GANs, transformers, and graph neural networks applied to operational metric streams. Directly relevant to anomaly-based ML alerting.
Karval, Singh, et al. (2025)arXiv preprint, 2025
A multivocal literature review synthesizing academic research and industry practice on ML monitoring. Categorizes monitoring methods under data drift, outlier detection, and adversarial detection. Proposes a five-step framework: define, measure, assess, act, and control.
Various (2023)arXiv preprint, 2023
Addresses how maintaining industry safety standards for AI/ML model robustness requires continuous monitoring for faults and performance drops. Proposes using Population Stability Index (PSI) as a practical metric for detecting distribution shifts that trigger alerts.
Sambasivan et al. (2024)arXiv preprint, 2024
Interview study of ML engineers revealing that practitioners closely monitor deployed models using on-call rotations, data monitoring, and rule-based guardrails. Documents pain points including alert fatigue from alerting systems and the difficulty of setting appropriate thresholds.
Various (2024)ScienceDirect, 2024
Proposes a machine learning framework (TEQ) for reducing alert fatigue in monitoring systems. Achieved 22.9% reduction in response time to actionable incidents and suppressed 54% of false positives while maintaining a 95.1% detection rate.
Interview & Evaluation Perspective
Common Interview Questions
- ●
How would you design an alerting system for 50+ ML models in production?
- ●
What is the difference between threshold-based, anomaly-based, and composite alerts? When would you use each?
- ●
How do you prevent alert fatigue in an ML monitoring system?
- ●
Explain SLO-based burn rate alerting. How does it differ from static threshold alerting?
- ●
How would you design an escalation policy for an ML platform team of 6 engineers?
- ●
What metrics would you alert on for an ML model, and at what severity levels?
- ●
How do you monitor the monitoring system itself? What happens if your alerting pipeline fails?
- ●
Describe the tradeoff between alerting sensitivity and noise. How would you calibrate for a fraud detection model vs. a recommendation model?
Key Points to Mention
- ●
The three alert types (threshold, anomaly, composite) serve different purposes: known knowns, known unknowns, and noise reduction respectively. A production system needs all three.
- ●
SLO-based burn rate alerting (from Google SRE) is the gold standard -- it reduces paging volume by 90%+ compared to raw threshold alerting while maintaining detection quality.
- ●
Alert fatigue is the #1 operational failure mode. Track alert-to-incident ratio and target >80% alert precision. Schedule monthly alert hygiene reviews to retire or tune noisy alerts.
- ●
Dead man's switch (watchdog) alerts solve the meta-monitoring problem: a heartbeat alert that pages when it STOPS firing, catching monitoring pipeline failures.
- ●
Inhibition rules and alert grouping are essential for preventing alert storms during cascading failures. If the database is down, suppress all model quality alerts that are symptoms of the same root cause.
- ●
Runbooks transform alerting from noise into actionable response. Every paging alert should link to a runbook with diagnostic steps, decision trees, and remediation procedures.
- ●
For ML-specific alerting, the key metrics are: prediction latency (P99), error rate, prediction distribution (PSI), feature null rates, and drift scores. Infrastructure metrics (CPU, memory, disk) are necessary but not sufficient.
Pitfalls to Avoid
- ●
Claiming you would alert on every metric at the same severity -- this demonstrates no understanding of alert prioritization and guarantees alert fatigue.
- ●
Ignoring the human side of alerting: on-call rotation, escalation policies, burnout prevention, and the 'who watches the watchman' problem.
- ●
Proposing static thresholds for all metrics without acknowledging that some metrics (prediction distributions, traffic volumes) have natural seasonal variation that requires dynamic baselines.
- ●
Forgetting to mention alert deduplication and grouping -- without these, a single root cause generates dozens of independent pages.
- ●
Not discussing runbooks. Alerting without runbooks is just noise. Every senior interviewer will want to know how you connect detection to response.
Senior-Level Expectation
A senior or staff-level candidate should discuss the full alerting lifecycle: metric selection tied to business SLOs, multi-tier severity classification (P1-P4) with clear routing rules, composite alert design that reduces false positives, escalation policy design with realistic timeouts, runbook creation and maintenance processes, the feedback loop of post-incident reviews that improve alert quality over time, and capacity planning for the monitoring infrastructure itself. They should reference Google SRE practices (burn rate alerting, error budgets) and demonstrate awareness of organizational dynamics -- alert fatigue, on-call burnout, the politics of who gets paged. A senior candidate working in India should be able to discuss timezone-aware on-call scheduling across IST and US time zones for globally distributed teams, and cost optimization of monitoring infrastructure (self-hosted Prometheus vs. managed Datadog at INR 1.7 lakh+/month for enterprise plans).
Summary
An alerting system is the operational nerve center that transforms passive ML monitoring into active incident response. It evaluates metric streams from model serving infrastructure, drift detectors, and feature pipelines against a combination of threshold-based rules, anomaly detection algorithms, and composite alert logic, then routes notifications to the right people through the right channels at the right severity level.
The key design principles are: (1) SLO-based burn rate alerting (from Google SRE) dramatically reduces alert noise by focusing on error budget consumption rates rather than raw metric thresholds, achieving 90%+ reduction in paging volume. (2) Composite alerts require multiple correlated signals to co-occur before firing, which eliminates most false positives from individual metric fluctuations. (3) Alert fatigue prevention through grouping, deduplication, inhibition rules, and regular alert hygiene reviews is not optional -- it's the difference between a functioning on-call rotation and an ignored PagerDuty account. (4) Dead man's switch alerts solve the meta-monitoring problem, ensuring the alerting pipeline itself is monitored for failures.
For production ML systems, alerting must cover both infrastructure metrics (latency, error rates, resource utilization) and ML-specific metrics (prediction distribution drift, feature null rates, confidence score shifts). The implementation path typically starts with Prometheus + Alertmanager for rule evaluation and notification, integrates with PagerDuty or Grafana OnCall for incident management and escalation, and adds ML-specific monitoring tools like Evidently AI or NannyML for drift detection and label-free performance estimation. The most impactful investment is not in tooling but in organizational process: runbooks, escalation policies, on-call rotation, and the post-incident review loop that continuously improves alert quality over time.