CTR / Conversion in Machine Learning
Here is a deceptively simple question: a user sees your recommendation, your ad, your search result. Did they click? Did they buy?
Click-Through Rate (CTR) and conversion rate are the two metrics that connect ML model predictions to actual business outcomes. Every recommendation engine, ad platform, and search system ultimately answers to these numbers. You can have a model with perfect NDCG and stellar AUC, but if users are not clicking and not converting, none of it matters.
CTR measures the fraction of impressions that result in a click. Conversion rate extends this to the fraction of impressions (or clicks) that result in a desired action -- a purchase, a signup, a subscription. Together, they form the core business metrics for any system that surfaces items to users.
What makes CTR fascinating from an ML perspective is that it is both a metric and a prediction target. You measure CTR to evaluate your system, and you build models to predict CTR so you can rank items by their expected click probability. This dual role -- evaluation metric and model objective -- makes CTR uniquely important in the ML ecosystem.
From Google's ad auction (where predicted CTR directly determines ad revenue) to Flipkart's product search (where CTR correlates with purchase intent) to Swiggy's restaurant ranking (where CTR on a restaurant card predicts order likelihood), CTR sits at the intersection of machine learning and business value. Understanding how to measure it correctly, predict it accurately, and avoid its many pitfalls is essential for any ML engineer working on user-facing systems.
Concept Snapshot
- What It Is
- Click-Through Rate (CTR) is the ratio of clicks to impressions, measuring the proportion of users who interact with an item after seeing it; conversion rate extends this to downstream actions like purchases or signups.
- Category
- Evaluation
- Complexity
- Intermediate
- Inputs / Outputs
- Inputs: impression logs (user-item pairs shown) and click/conversion event logs. Outputs: CTR as a ratio (0 to 1), conversion rate as a ratio, and optionally predicted CTR scores per item.
- System Placement
- Used as an online evaluation metric during A/B testing, as a training target for ranking/recommendation models, and as a real-time signal in ad auction systems and feed ranking pipelines.
- Also Known As
- Click-Through Rate, Click Rate, Clickthrough Ratio, CVR (Conversion Rate), pCTR (Predicted CTR), Impression-to-Click Ratio
- Typical Users
- ML Engineers, Data Scientists, Growth Engineers, Ad Tech Engineers, Product Managers, Recommendation System Developers
- Prerequisites
- Basic probability and statistics, Binary classification concepts, Impression and click logging infrastructure, A/B testing fundamentals, Understanding of ranking systems
- Key Terms
- CTRconversion rateimpressionposition biaspCTRimpression-weighted CTRclick attributiondwell timepost-click conversionad auction
Why This Concept Exists
The Gap Between Model Quality and Business Impact
Early ML systems for ranking and recommendation were evaluated with offline metrics: AUC, NDCG, precision@K. These metrics measure model quality in a vacuum -- how well does the model predict relevance given labeled data? But they don't answer the question that matters to the business: are users actually engaging with what we show them?
A recommendation system might achieve NDCG@10 of 0.92, but if users ignore the recommendations and go straight to the search bar, that score is meaningless. CTR bridges this gap. It measures whether the model's output translates into observable user behavior.
From Ad Auctions to Everywhere
CTR as a formal metric has its roots in online advertising. In the early 2000s, Google's AdWords system faced a critical challenge: how do you rank ads when advertisers bid different amounts? Simply ranking by bid price maximizes short-term revenue but destroys user experience (irrelevant ads get shown). Google's solution was to rank by expected revenue = bid x predicted CTR. This made CTR prediction the central ML problem in ad tech.
The insight was revolutionary: an ad that costs 0.05 per impression) than an ad that costs 0.02 per impression). Predicted CTR became the mechanism that aligned user experience with advertiser value.
From ad systems, CTR expanded to recommendation systems (Netflix: "did the user click on the recommended show?"), search engines ("did the user click on the search result?"), email marketing ("did the user open the email?"), and push notifications ("did the user tap the notification?"). Today, virtually every user-facing ML system measures some form of CTR.
Why Not Just Use Offline Metrics?
Offline metrics like NDCG or AUC are computed on static datasets with pre-labeled relevance judgments. They have three fundamental limitations that CTR addresses:
- They require explicit labels. NDCG needs human-annotated relevance scores. CTR is implicitly collected from user behavior -- no labeling cost.
- They don't capture the full user experience. A ranking might be "correct" by NDCG but fail because the item titles are confusing, the images are unappealing, or the prices are wrong. CTR captures the holistic user response.
- They are static. Offline metrics are computed once on a fixed test set. CTR is computed continuously on live traffic, capturing distribution shifts, seasonal trends, and changing user preferences.
Key Insight: CTR exists because businesses need a metric that is cheap to collect (no manual labeling), reflects real user behavior (not proxy labels), and updates continuously (not static evaluations). It is the closest thing to a universal online metric for user-facing ML systems.
Core Intuition & Mental Model
The Simplest Version
Imagine you run a street food stall in Chandni Chowk, Delhi. You put up a sign advertising your special chaat. In one hour, 200 people walk past (impressions) and 30 stop to buy (clicks). Your CTR is 30/200 = 15%.
Now you change the sign to include a photo of the chaat. Next hour, 200 people walk past and 50 stop. CTR jumps to 25%. The sign (your "model") improved because more people responded to what you showed them.
Conversion takes this one step further: of those 50 who stopped, 40 actually bought something. Your conversion rate from impression is 40/200 = 20%. Your conversion rate from click is 40/50 = 80%.
This is CTR in a nutshell: what fraction of people who saw something took the desired action?
Why CTR Is Both a Metric and a Target
Here is what makes CTR unique among ML metrics: it is simultaneously the thing you measure and the thing you predict.
When you measure CTR, you are evaluating your system: "How well is our recommendation engine performing?" You look at the aggregate CTR across all users and items.
When you predict CTR, you are building the system itself: "Which item should I show this user?" You train a model to estimate the probability that a specific user will click on a specific item, and then you rank items by predicted CTR (or expected revenue = predicted CTR x item value).
This dual role creates a feedback loop: your CTR prediction model determines what gets shown, which determines what gets clicked, which determines the training data for the next version of the model. Getting this loop right is one of the central challenges of production ML.
The Position Bias Problem (Why Raw CTR Lies)
Here is a critical intuition that separates beginners from practitioners: raw CTR is heavily biased by position.
An item shown at position 1 of a search result gets clicked 10x more than the same item shown at position 10, regardless of relevance. If you measure raw CTR without accounting for position, you conclude that position-1 items are inherently better -- but they are only getting more clicks because they are at the top.
This is like concluding that the first stall in a food court is the best restaurant because it has the most customers. No -- it just has the most foot traffic. Position bias makes naive CTR measurement unreliable and CTR prediction much harder than it appears.
Technical Foundations
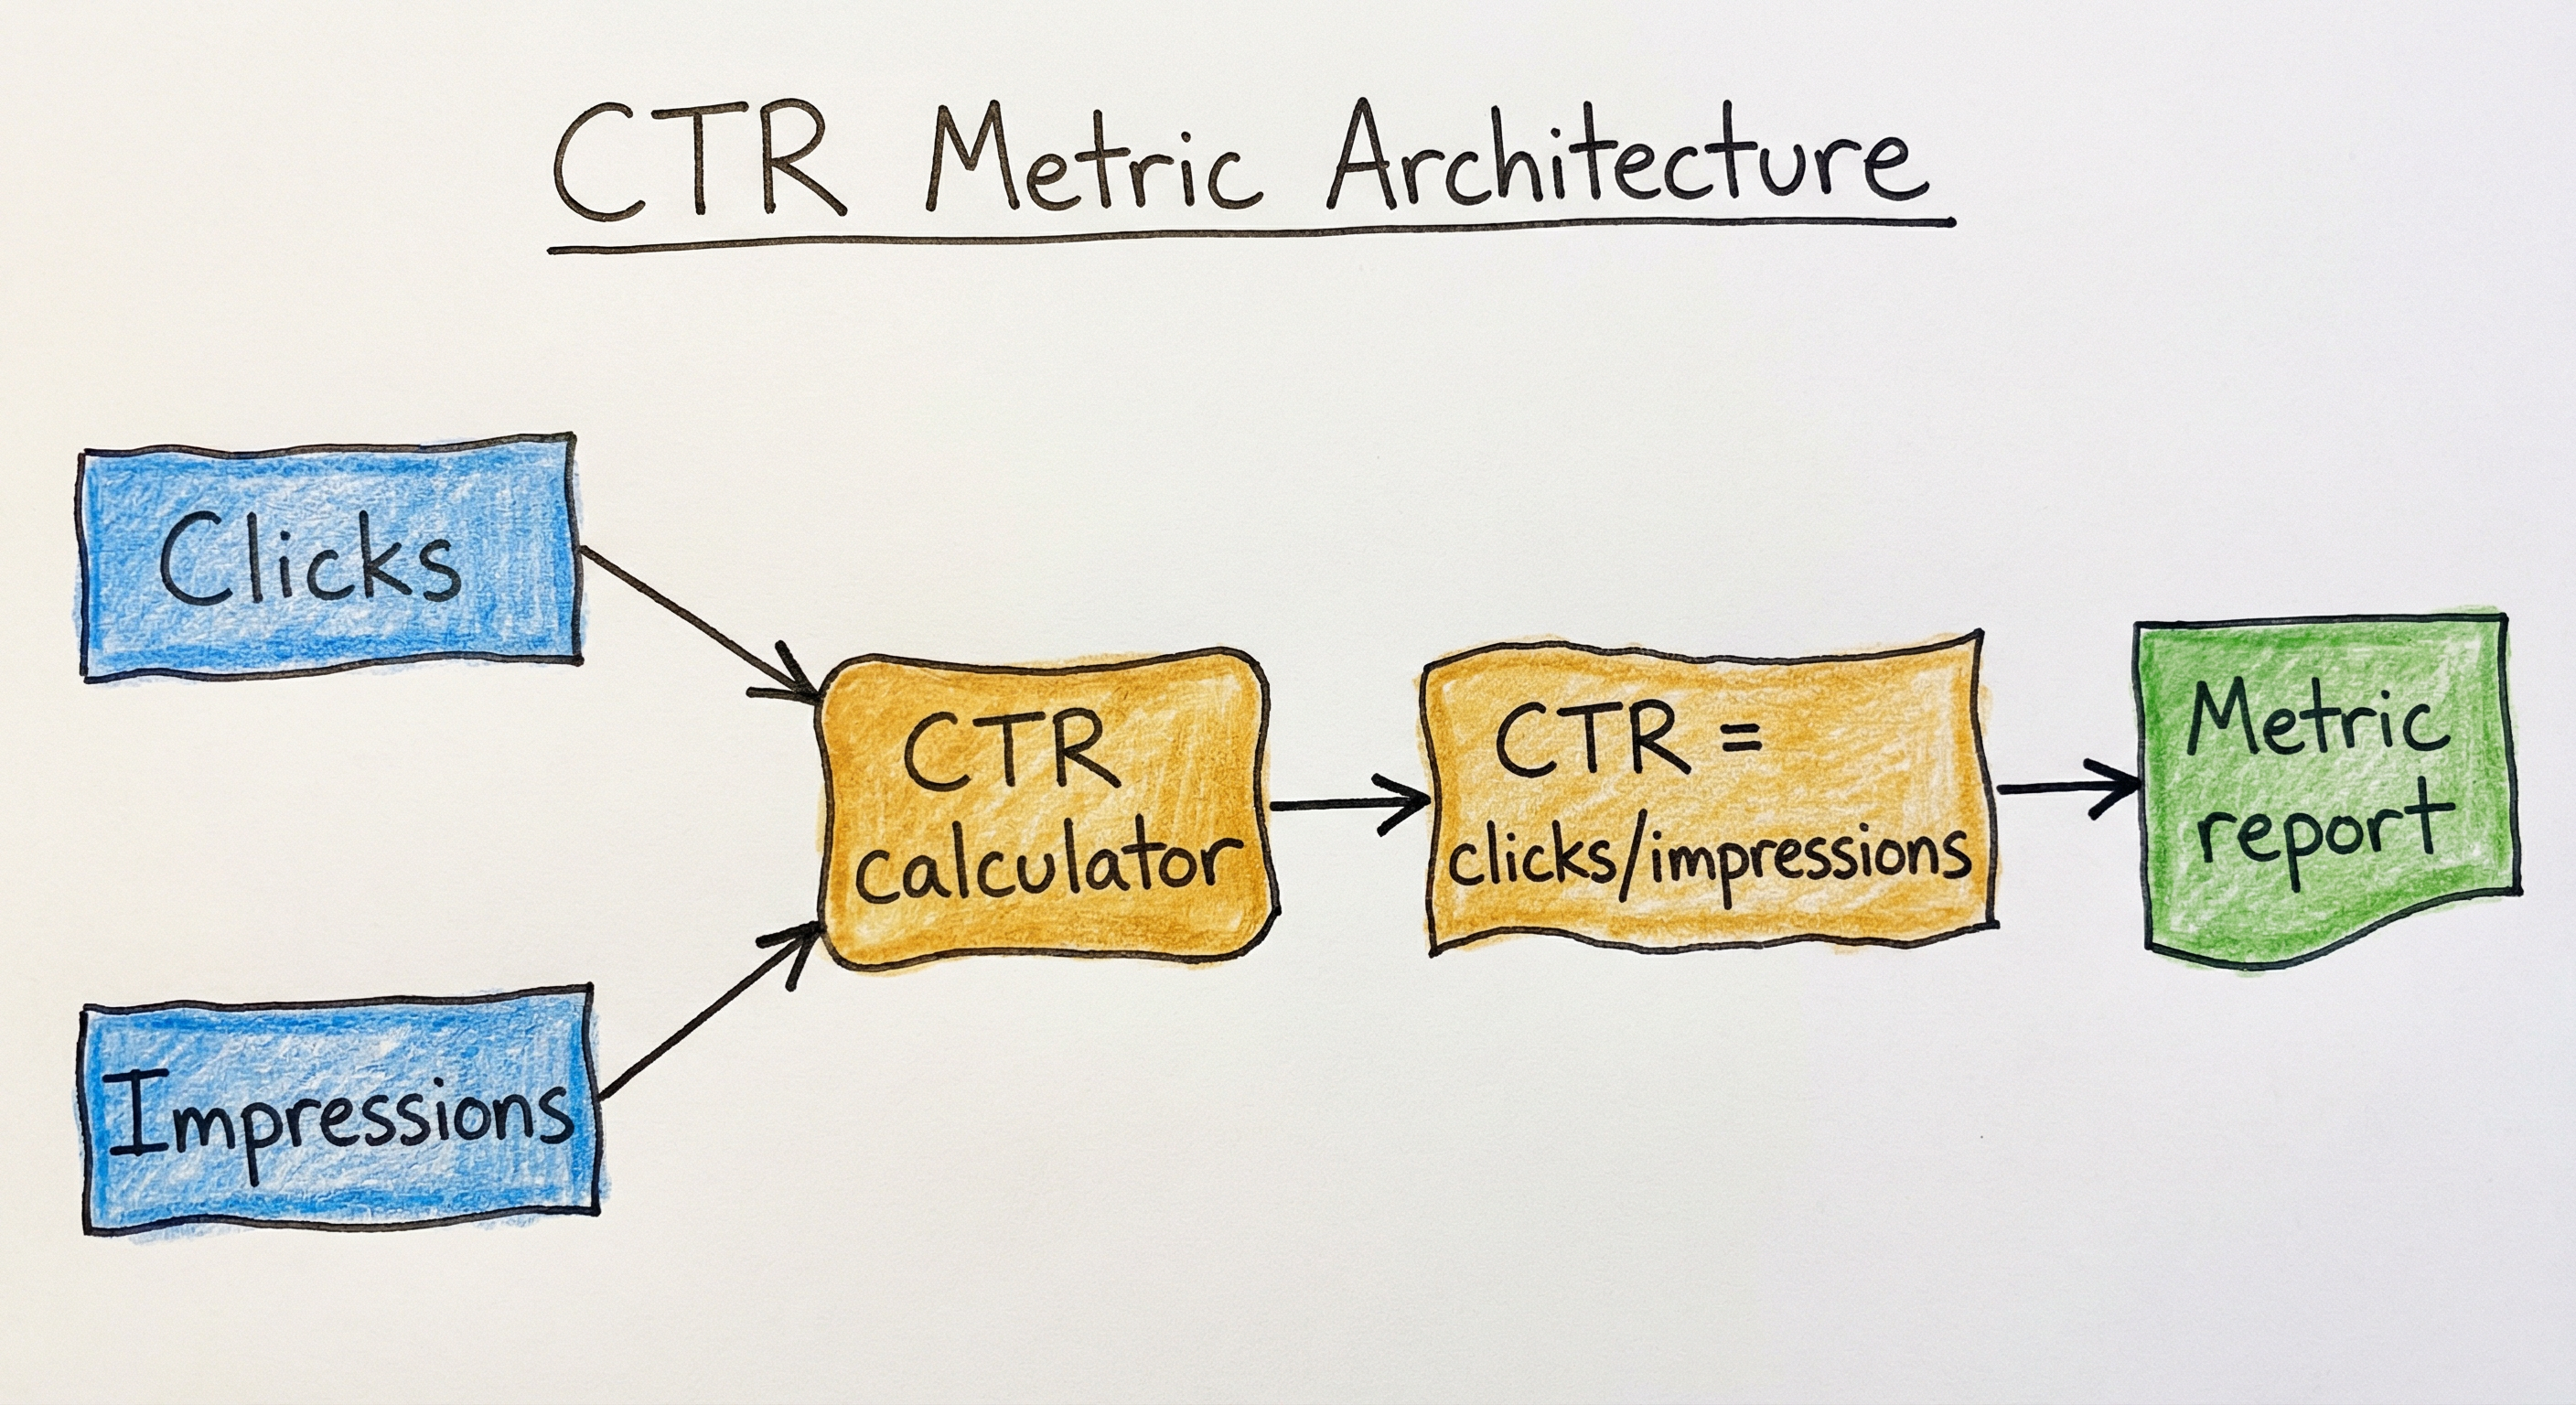
Basic CTR Formula
For a set of impressions and corresponding clicks :
For a specific item shown to user , the predicted CTR (pCTR) is:
where context includes position, time, device, and other features.
Conversion Rate
Conversion rate can be defined at two levels:
Impression-level conversion rate:
Click-level conversion rate (post-click CVR):
The relationship between them is:
Impression-Weighted CTR
When comparing CTR across different segments (e.g., categories, user cohorts), simple averaging can be misleading. Impression-weighted CTR corrects for this:
where is the number of impressions in segment and is the CTR for that segment. This is equivalent to computing the global CTR across all impressions.
Position-Debiased CTR
To correct for position bias, we factor CTR into an examination probability and a relevance probability:
This is the examination hypothesis from the position bias literature. The true relevance of item to user is:
The examination probability is typically estimated via randomized experiments or propensity estimation.
CTR Prediction as Binary Classification
CTR prediction is a binary classification problem with severe class imbalance. Given user features , item features , and context features :
where is the sigmoid function and is the learned function. The loss is typically log loss (binary cross-entropy):
where is the actual click/no-click label.
Expected Revenue (Ad Ranking)
In ad systems, the ranking score combines CTR with bid:
This is the mechanism behind Google Ads, Meta Ads, and most ad auction systems. The pCTR model directly determines which ads appear and how much revenue the platform generates.
Key Point: CTR as a formula is trivially simple (clicks/impressions). The complexity lies in predicting it accurately (feature engineering, deep models, position debiasing) and measuring it correctly (attribution windows, impression counting, statistical testing).
Internal Architecture
CTR measurement and prediction involve a full-stack architecture spanning data collection, model training, real-time inference, and feedback loops. Unlike offline metrics that sit outside the serving path, CTR is deeply embedded in the production system -- the prediction model is part of the ranking pipeline, and the measurement system feeds training data back to the model.
The architecture has two major loops. The serving loop (A through E) handles real-time requests: a user action triggers feature lookup, CTR prediction, ranking, and item display. The feedback loop (F through K) captures user responses: impressions are logged, clicks are tracked, CTR is computed, and the data flows back to retrain the model. The health of this feedback loop determines whether the system improves over time or degrades.
Key Components
Feature Store
Serves real-time and batch features for CTR prediction: user profile features (demographics, history, preferences), item features (category, price, popularity, embeddings), and context features (time of day, device, location, session depth). Latency requirement is typically under 10ms for real-time features.
CTR Prediction Model
A trained model (logistic regression, DeepFM, DCN, DIN, or transformer-based) that takes user-item-context features and outputs a predicted click probability between 0 and 1. Serves predictions at scale with p99 latency under 20ms. Often deployed as a two-stage system: a lightweight model for candidate generation and a heavier model for final ranking.
Ranking / Auction Engine
Combines predicted CTR with business logic (bids in ad systems, diversity constraints in recommendations, freshness boosts in feeds) to produce the final ranked list shown to the user. In ad systems, this is the auction mechanism; in recommendations, this is the re-ranking stage.
Impression Logger
Records every item shown to every user with a unique impression ID, timestamp, position, and context. This is the denominator of CTR. Must handle millions of events per second with minimal loss. Typically uses Kafka or a similar streaming system.
Click Tracker
Captures click events and joins them with impression IDs. Handles client-side and server-side tracking, deduplication (user clicking the same item twice), and bot filtering. The click join window (how long after an impression a click counts) is a critical design decision.
Attribution Engine
Determines which impression caused which conversion. Handles multi-touch attribution (user saw an ad, then searched, then bought -- which touchpoint gets credit?), view-through attribution (user saw but did not click, then converted later), and click-through attribution windows (typically 1-30 days).
CTR Computation Module
Aggregates impression and click logs to compute CTR at various granularities: overall, per-position, per-user-segment, per-item-category, per-experiment-variant. Feeds into dashboards, A/B test analysis, and alerting systems.
Training Pipeline
Consumes impression-click pairs as training data, applies negative sampling, handles delayed conversions, and retrains the CTR model on a regular schedule (hourly to daily). Must handle the feedback loop carefully to avoid training on biased data.
Data Flow
Real-time serving path (< 100ms): User opens app -> feature store retrieves user/item/context features -> CTR model scores all candidates -> ranker sorts by pCTR with diversity constraints -> top-K items served, impression logger fires.
Feedback loop (hourly to daily): Impression and click events land in data lake -> join job matches clicks to impressions by impression ID -> CTR aggregation by experiment variant, position, category -> training pipeline samples pairs with negative downsampling -> new model trained, validated (AUC, log loss, calibration) -> deployed via A/B test against previous model.
A flow starting from 'User Request' through 'Feature Store' and 'CTR Prediction Model' to 'Ranking/Auction' and 'Served Items'. From there, a feedback loop flows through 'Impression Logger', 'Click Tracker', 'Attribution Engine', and 'CTR Computation', which branches to 'A/B Test Analysis' and 'Training Pipeline'. The training pipeline feeds back into the CTR Prediction Model, completing the loop.
How to Implement
Implementing CTR: Measurement vs. Prediction
There are two distinct implementation challenges:
CTR Measurement -- computing the metric from production logs. This involves event logging, click-impression joining, position debiasing, and statistical testing. The engineering challenge is handling billions of events with correct attribution.
CTR Prediction -- building models that predict click probability. This ranges from simple logistic regression (still surprisingly effective) to deep learning architectures like DeepFM and DCN. The ML challenge is capturing complex feature interactions at scale.
We will cover both. For measurement, the key is getting the data pipeline right (most CTR bugs are data bugs, not model bugs). For prediction, the key is feature engineering and choosing the right model architecture for your scale.
Cost Note: A production CTR prediction system serving 100K requests/second on AWS typically costs INR 15-30 lakh/month (36K) for compute alone (GPU instances for model inference, Redis for feature store, Kafka for event streaming). For smaller scale (1K requests/second), expect INR 1-3 lakh/month (3.6K) using CPU-based inference.
import pandas as pd
import numpy as np
from scipy import stats

# Load impression and click logs
impressions = pd.DataFrame({
    'impression_id': range(10000),
    'user_id': np.random.randint(0, 1000, 10000),
    'item_id': np.random.randint(0, 500, 10000),
    'position': np.random.randint(1, 21, 10000),
    'timestamp': pd.date_range('2026-01-01', periods=10000, freq='s'),
    'experiment_variant': np.random.choice(['control', 'treatment'], 10000),
})

# Simulate clicks (position-biased: higher positions get more clicks)
click_prob = 0.05 / np.log2(impressions['position'] + 1)
impressions['clicked'] = np.random.binomial(1, click_prob)

# --- Overall CTR ---
overall_ctr = impressions['clicked'].mean()
print(f"Overall CTR: {overall_ctr:.4f} ({overall_ctr*100:.2f}%)")

# --- CTR by position (reveals position bias) ---
ctr_by_position = impressions.groupby('position').agg(
    impressions_count=('clicked', 'count'),
    clicks=('clicked', 'sum'),
    ctr=('clicked', 'mean')
).reset_index()
print("\nCTR by Position (top 5):")
print(ctr_by_position.head())

# --- CTR by experiment variant with confidence intervals ---
def ctr_with_ci(group, confidence=0.95):
    n = len(group)
    clicks = group.sum()
    ctr = clicks / n
    # Wilson score interval (better than normal approx for small CTR)
    z = stats.norm.ppf((1 + confidence) / 2)
    denominator = 1 + z**2 / n
    center = (ctr + z**2 / (2 * n)) / denominator
    margin = z * np.sqrt((ctr * (1 - ctr) + z**2 / (4 * n)) / n) / denominator
    return pd.Series({
        'ctr': ctr,
        'ci_lower': center - margin,
        'ci_upper': center + margin,
        'impressions': n,
        'clicks': clicks
    })

results = impressions.groupby('experiment_variant')['clicked'].apply(ctr_with_ci)
print("\nCTR by Experiment Variant:")
print(results)
This example shows production-style CTR measurement from impression/click logs. Key points: (1) CTR by position reveals position bias -- position 1 has much higher CTR than position 10 regardless of item quality. (2) Wilson score confidence intervals are used instead of normal approximation because CTR values are often small (1-5%), making the normal approximation inaccurate. (3) The experiment variant split enables A/B test comparison.
import numpy as np
from sklearn.linear_model import LogisticRegression
from sklearn.preprocessing import OneHotEncoder
from sklearn.pipeline import Pipeline
from sklearn.compose import ColumnTransformer
from sklearn.metrics import roc_auc_score, log_loss
from sklearn.model_selection import train_test_split

# Simulate CTR training data
np.random.seed(42)
n_samples = 100000

data = pd.DataFrame({
    'user_age_bucket': np.random.choice(['18-24', '25-34', '35-44', '45+'], n_samples),
    'user_gender': np.random.choice(['M', 'F', 'Other'], n_samples),
    'item_category': np.random.choice(['electronics', 'fashion', 'food', 'home'], n_samples),
    'item_price_bucket': np.random.choice(['low', 'mid', 'high', 'premium'], n_samples),
    'hour_of_day': np.random.randint(0, 24, n_samples),
    'device': np.random.choice(['mobile', 'desktop', 'tablet'], n_samples),
    'position': np.random.randint(1, 21, n_samples),
})

# Simulate click labels (with some realistic patterns)
click_prob = 0.03 + 0.02 * (data['item_category'] == 'fashion').astype(float)
click_prob += 0.01 * (data['device'] == 'mobile').astype(float)
click_prob /= np.log2(data['position'] + 1)  # Position bias
data['clicked'] = np.random.binomial(1, np.clip(click_prob, 0, 1))

print(f"Click rate: {data['clicked'].mean():.4f}")

# Feature engineering
categorical_features = ['user_age_bucket', 'user_gender', 'item_category',
                        'item_price_bucket', 'device']
numeric_features = ['hour_of_day', 'position']

preprocessor = ColumnTransformer([
    ('cat', OneHotEncoder(handle_unknown='ignore', sparse_output=True), categorical_features),
    ('num', 'passthrough', numeric_features),
])

# Train/test split
X = data.drop('clicked', axis=1)
y = data['clicked']
X_train, X_test, y_train, y_test = train_test_split(X, y, test_size=0.2, random_state=42)

# Logistic Regression (strong baseline for CTR)
model = Pipeline([
    ('preprocessor', preprocessor),
    ('classifier', LogisticRegression(max_iter=1000, C=0.1))
])

model.fit(X_train, y_train)

# Evaluate
y_pred_proba = model.predict_proba(X_test)[:, 1]
print(f"AUC: {roc_auc_score(y_test, y_pred_proba):.4f}")
print(f"Log Loss: {log_loss(y_test, y_pred_proba):.4f}")

# Calibration check: predicted CTR should match actual CTR
buckets = pd.qcut(y_pred_proba, q=10, duplicates='drop')
calibration = pd.DataFrame({'predicted': y_pred_proba, 'actual': y_test})
calibration['bucket'] = buckets
cal_table = calibration.groupby('bucket').agg(
    mean_predicted=('predicted', 'mean'),
    mean_actual=('actual', 'mean'),
    count=('actual', 'count')
)
print("\nCalibration (predicted vs actual CTR by decile):")
print(cal_table)
Logistic regression remains a surprisingly strong baseline for CTR prediction and is still used in production at many companies. This example demonstrates the full workflow: feature engineering with categorical encoding, train/test split, model training, and crucially, calibration checking. Calibration is critical for CTR models because predicted probabilities are used directly in ranking and bidding -- if the model says 5% CTR, you want actual CTR to be close to 5%. AUC measures ranking quality, but calibration measures probability accuracy.
import torch
import torch.nn as nn
import torch.optim as optim
from torch.utils.data import DataLoader, TensorDataset
import numpy as np

class DeepFM(nn.Module):
    """DeepFM: combines Factorization Machines (feature interactions)
    with a Deep Neural Network (high-order patterns).

    Used by Huawei, JD.com, and many ad/rec systems for CTR prediction.
    """
    def __init__(self, field_dims, embed_dim=16, mlp_dims=(256, 128, 64)):
        super().__init__()
        self.num_fields = len(field_dims)
        self.total_dims = sum(field_dims)

        # First-order (linear) embeddings
        self.linear_embedding = nn.Embedding(self.total_dims, 1)
        self.linear_bias = nn.Parameter(torch.zeros(1))

        # Second-order (FM) embeddings
        self.fm_embedding = nn.Embedding(self.total_dims, embed_dim)

        # Deep component
        deep_input_dim = self.num_fields * embed_dim
        layers = []
        prev_dim = deep_input_dim
        for dim in mlp_dims:
            layers.extend([
                nn.Linear(prev_dim, dim),
                nn.BatchNorm1d(dim),
                nn.ReLU(),
                nn.Dropout(0.2),
            ])
            prev_dim = dim
        layers.append(nn.Linear(prev_dim, 1))
        self.deep = nn.Sequential(*layers)

        # Offset for each field
        offsets = np.array((0, *np.cumsum(field_dims)[:-1]), dtype=np.int64)
        self.register_buffer('offsets', torch.from_numpy(offsets))

    def forward(self, x):
        # x shape: (batch_size, num_fields) -- integer feature indices
        x = x + self.offsets.unsqueeze(0)

        # Linear (first-order)
        linear_out = self.linear_embedding(x).squeeze(-1).sum(dim=1)
        linear_out = linear_out + self.linear_bias

        # FM (second-order interactions)
        fm_embed = self.fm_embedding(x)  # (batch, fields, embed_dim)
        square_of_sum = fm_embed.sum(dim=1).pow(2)  # (batch, embed_dim)
        sum_of_square = fm_embed.pow(2).sum(dim=1)   # (batch, embed_dim)
        fm_out = 0.5 * (square_of_sum - sum_of_square).sum(dim=1)

        # Deep (high-order)
        deep_input = fm_embed.view(fm_embed.size(0), -1)  # (batch, fields * embed_dim)
        deep_out = self.deep(deep_input).squeeze(1)

        # Combine
        logits = linear_out + fm_out + deep_out
        return torch.sigmoid(logits)

# Example usage
field_dims = [1000, 500, 50, 24, 3]  # user, item, category, hour, device
model = DeepFM(field_dims, embed_dim=16)

# Dummy training data
X_train = torch.randint(0, 50, (10000, 5))  # 10K samples, 5 fields
y_train = torch.randint(0, 2, (10000,)).float()

dataset = TensorDataset(X_train, y_train)
loader = DataLoader(dataset, batch_size=256, shuffle=True)

optimizer = optim.Adam(model.parameters(), lr=1e-3)
criterion = nn.BCELoss()

# Train one epoch
model.train()
for batch_x, batch_y in loader:
    pred = model(batch_x)
    loss = criterion(pred, batch_y)
    optimizer.zero_grad()
    loss.backward()
    optimizer.step()

print(f"Final batch loss: {loss.item():.4f}")
print(f"Model parameters: {sum(p.numel() for p in model.parameters()):,}")
DeepFM (Guo et al., 2017) is one of the most widely used deep CTR models. It combines three components: (1) a linear layer for first-order feature importance, (2) a Factorization Machine layer for second-order feature interactions (user x item, category x time), and (3) a deep neural network for high-order patterns. The FM component is key -- it efficiently captures all pairwise feature interactions without explicitly enumerating them. This architecture is used in production at Huawei, JD.com, and many ad tech companies.
import numpy as np
import pandas as pd

def estimate_position_propensity(logs, method='empirical'):
    """Estimate P(examine | position) from impression logs.

    Uses result randomization data where items are shown
    at random positions to break the position-relevance correlation.
    """
    if method == 'empirical':
        # From randomized experiment data
        propensity = logs.groupby('position')['clicked'].mean()
        # Normalize so position 1 has propensity 1.0
        propensity = propensity / propensity.iloc[0]
        return propensity
    elif method == 'power_law':
        # Parametric: P(examine | pos) = 1 / pos^gamma
        # Fit gamma from randomization data
        positions = logs['position'].values
        clicks = logs['clicked'].values
        from scipy.optimize import minimize_scalar
        def neg_ll(gamma):
            prop = 1.0 / (positions ** gamma)
            pred = prop * clicks.mean()  # simplified
            return -np.sum(clicks * np.log(pred + 1e-10) +
                          (1 - clicks) * np.log(1 - pred + 1e-10))
        result = minimize_scalar(neg_ll, bounds=(0.1, 3.0), method='bounded')
        gamma = result.x
        return pd.Series(
            1.0 / np.arange(1, 21) ** gamma,
            index=range(1, 21)
        )

def compute_debiased_ctr(logs, propensity):
    """Compute position-debiased CTR using Inverse Propensity Scoring.

    debiased_CTR(item) = (1/N) * sum(click_i / propensity(pos_i))
    """
    logs = logs.copy()
    logs['propensity'] = logs['position'].map(propensity)
    logs['ips_weight'] = logs['clicked'] / logs['propensity']

    debiased = logs.groupby('item_id').agg(
        raw_ctr=('clicked', 'mean'),
        debiased_ctr=('ips_weight', 'mean'),
        impressions=('clicked', 'count'),
        avg_position=('position', 'mean')
    ).reset_index()

    return debiased

# Example
np.random.seed(42)
n = 50000
logs = pd.DataFrame({
    'item_id': np.random.randint(0, 100, n),
    'position': np.random.randint(1, 21, n),
    'clicked': np.zeros(n)
})
# Items at lower positions get more clicks (position bias)
base_relevance = np.random.rand(100) * 0.1  # True item relevance
for idx in logs.index:
    item = logs.loc[idx, 'item_id']
    pos = logs.loc[idx, 'position']
    exam_prob = 1.0 / np.log2(pos + 1)  # Examination probability
    click_prob = exam_prob * base_relevance[item]
    logs.loc[idx, 'clicked'] = np.random.binomial(1, min(click_prob, 1.0))

# Estimate propensity and debias
propensity = estimate_position_propensity(logs)
debiased = compute_debiased_ctr(logs, propensity)

print("Top 5 items by raw CTR vs debiased CTR:")
print(debiased.nlargest(5, 'raw_ctr')[['item_id', 'raw_ctr', 'debiased_ctr', 'avg_position']])
print("\nTop 5 items by debiased CTR:")
print(debiased.nlargest(5, 'debiased_ctr')[['item_id', 'raw_ctr', 'debiased_ctr', 'avg_position']])
Position bias is the biggest pitfall in CTR measurement. This example shows how to debias CTR using Inverse Propensity Scoring (IPS): divide each click by the probability that the user examined that position. Items that get clicks despite being shown at low positions get higher debiased CTR (they are genuinely relevant), while items that get clicks only because they are at position 1 get their CTR corrected downward. The propensity function is estimated from randomized experiments where items are shown at random positions.
# CTR measurement pipeline config (YAML)
impression_tracking:
  viewability_threshold: 0.5        # 50% of pixels visible
  viewability_duration_ms: 1000     # For at least 1 second
  dedup_window_seconds: 3600        # Dedup impressions within 1 hour
  bot_filter: true                  # Exclude known bot user agents

click_attribution:
  click_window_seconds: 1800        # 30-min click window after impression
  view_through_window_hours: 168    # 7-day view-through window
  dedup_clicks: true                # Count only first click per session
  cross_device: false               # Single-device attribution

position_debiasing:
  method: inverse_propensity_scoring
  propensity_estimation: power_law  # or 'empirical'
  randomization_traffic_pct: 1.0    # 1% traffic for propensity estimation

ab_testing:
  minimum_impressions: 10000        # Per variant
  significance_level: 0.05
  correction: bonferroni             # For multiple comparisons
  metric: impression_weighted_ctr    # Primary metric
  guardrail_metrics:                 # Must not regress
    - conversion_rate
    - revenue_per_impression
    - bounce_rate
Common Implementation Mistakes
- ●
Not accounting for position bias: Treating raw CTR as a measure of item quality when it is heavily confounded by position. An item shown at position 1 always gets higher CTR than the same item at position 10. Always compute position-normalized CTR or use IPS debiasing when comparing items.
- ●
Ignoring impression counting rules: Counting an impression when the item is loaded in the DOM vs. when it is actually visible on screen (viewable impression) can change CTR by 2-5x. Define clear viewability rules (e.g., 50% of pixels visible for at least 1 second) and stick to them.
- ●
Using CTR as the only success metric: CTR measures clicks, not value. Clickbait titles have high CTR but lead to bounces and user dissatisfaction. Always pair CTR with downstream metrics: dwell time, conversion rate, return rate, long-term retention.
- ●
Training on biased click data without correction: The model learns from what was shown, not what should have been shown. Items never shown in position 1 appear to have low CTR, so the model never promotes them -- a self-reinforcing feedback loop. Use exploration (epsilon-greedy, Thompson sampling) or IPS corrections.
- ●
Incorrect attribution windows: Setting the click-to-impression join window too short (missing delayed clicks) or too long (attributing unrelated clicks). For web search, 30 minutes is typical. For display ads, 24 hours for click-through and 7-30 days for view-through attribution.
- ●
Comparing CTR across different surfaces: Mobile app CTR, desktop web CTR, and email CTR are not comparable because examination probabilities differ fundamentally. A 2% CTR on email is excellent; a 2% CTR on a recommendation carousel might be poor. Always segment by surface.
When Should You Use This?
Use When
You are building a user-facing system that surfaces items (ads, products, content, notifications) and need to measure user engagement with what you show
You need an online evaluation metric that updates in real-time and does not require manual labeling -- CTR is collected automatically from user behavior
Your business model depends on user clicks or conversions (ad-supported platforms, e-commerce, subscription funnels) and you need a direct proxy for revenue
You are running A/B tests on ranking algorithms, UI changes, or recommendation models and need a primary success metric that reflects user response
You need a prediction target for training ranking models -- CTR prediction is the core ML problem in ad ranking, feed ranking, and notification targeting
You want to detect real-time quality regressions in your serving system -- a sudden CTR drop indicates something is wrong (model staleness, data pipeline failure, bug)
Avoid When
You only care about the quality of ranked lists and have access to human relevance labels -- use NDCG or MAP instead, which measure ranking quality directly without position bias confounds
Your task involves long-form content where 'clicks' are not the right signal (e.g., educational content where the goal is completion, not initial clicks) -- use completion rate or dwell time instead
You have a recommendation system where the goal is long-term user satisfaction, not short-term engagement -- CTR optimizes for immediacy and can lead to filter bubbles and clickbait
Your items have roughly equal click probability and differentiation is in post-click behavior (e.g., all search results look similar, but some have better content) -- use downstream conversion or satisfaction metrics
You are evaluating a system with very few impressions (< 1000 per variant in A/B tests) -- CTR estimates will be too noisy for reliable conclusions; wait for more traffic or use more sensitive metrics
You are in a domain where clicking is costless but the real action is expensive (e.g., users browse products freely but rarely buy) -- use conversion rate or revenue per impression instead of CTR
Key Tradeoffs
CTR vs. Downstream Metrics
The most important tradeoff with CTR is immediacy vs. value. CTR measures the first user action (click) but says nothing about what happens after. A clickbait headline has high CTR but leads to bounces, refunds, and churn. A high-quality but boring-looking result might have lower CTR but better conversion and retention.
The solution is to pair CTR with downstream metrics:
| Metric | Measures | Timeframe | Use With CTR |
|---|---|---|---|
| Dwell time | Post-click engagement | Seconds to minutes | Filters out clickbait |
| Conversion rate | Purchase/signup | Hours to days | Measures real business value |
| Bounce rate | Immediate disengagement | Seconds | Detects misleading CTR |
| Retention | Long-term satisfaction | Days to months | Guards against engagement traps |
| Revenue per impression | Monetization | Per impression | Holistic business metric |
Predicted CTR vs. Actual CTR
Another key tradeoff: do you optimize for predicted CTR (model output) or actual CTR (measured from logs)?
Predicted CTR is available at serving time and is used to rank items. But it is only as good as your model -- a miscalibrated model that predicts 10% when actual CTR is 5% will overbid in ad auctions.
Actual CTR is ground truth but only available after the fact. You can not use it to make real-time ranking decisions. And it is confounded by position bias.
The resolution: use predicted CTR for ranking, but continuously calibrate it against actual CTR. If the ratio of predicted to actual CTR drifts beyond a threshold (e.g., > 1.2 or < 0.8), trigger model retraining.
Impression-Weighted vs. Macro-Averaged CTR
When aggregating CTR across segments, you have a choice:
- Impression-weighted: Each impression counts equally. Heavily trafficked categories dominate. Better for overall business metrics.
- Macro-averaged: Each category/segment counts equally regardless of traffic. Better for understanding performance across the long tail.
Example: Category A has 1M impressions with 5% CTR. Category B has 1K impressions with 20% CTR. Impression-weighted CTR is ~5.0%. Macro-averaged CTR is 12.5%. Both are correct, but they answer different questions.
Key Insight: CTR is a necessary but insufficient metric for most ML systems. Always use it alongside downstream quality and business metrics. The company that optimizes only for CTR ends up with clickbait; the company that ignores CTR ends up with beautiful content nobody clicks on.
Alternatives & Comparisons
NDCG measures ranking quality using human-annotated relevance labels, while CTR measures actual user engagement. Use NDCG for offline evaluation with labeled test sets; use CTR for online evaluation with live traffic. NDCG is position-aware by design (discounts lower positions), while raw CTR is confounded by position bias and needs debiasing. NDCG requires expensive labels; CTR is collected for free from user behavior.
Hit rate measures whether at least one relevant item appears in the top-K results. It is binary (hit or miss) and position-unaware. CTR measures the aggregate rate of user engagement and captures gradations. Use hit rate when you care about coverage (did we retrieve any relevant item?); use CTR when you care about engagement quality (are users clicking on what we show?). Hit rate requires relevance labels; CTR uses implicit behavior.
A/B testing is the statistical framework for comparing CTR (and other metrics) between experiment variants. They are complementary, not alternatives: CTR is the metric, A/B testing is the methodology. You need both. An A/B test runner tells you whether a CTR difference is statistically significant; CTR tells the test runner what to measure.
AUC measures the quality of a binary classifier's ranked predictions (how well the model separates clicks from non-clicks). CTR measures the observed click rate in production. AUC is used during offline model development to assess CTR prediction quality; CTR is the online metric that validates whether the model improves user engagement. A model with good AUC but poor calibration can still produce bad CTR.
Precision, recall, and F1 evaluate classification at a fixed threshold, while CTR is a rate metric that does not depend on a threshold. For CTR prediction evaluation, AUC and log loss are preferred over precision/recall because the threshold is not meaningful -- you use the predicted probability directly for ranking. CTR as a metric measures system-level performance; precision/recall evaluate model-level performance.
Pros, Cons & Tradeoffs
Advantages
Directly measures user engagement -- unlike proxy metrics (NDCG, AUC), CTR reflects actual user behavior in production. A CTR improvement is a real improvement, not a test-set artifact.
Free to collect -- no manual labeling required. Every impression and click is logged automatically, giving you billions of data points at zero marginal cost.
Real-time signal -- CTR can be computed continuously, enabling real-time monitoring, alerting, and decision-making. A CTR drop triggers investigation within minutes, not weeks.
Universal applicability -- works for ads, recommendations, search, email, push notifications, and any system that shows items to users. The same metric, tooling, and methodology apply across surfaces.
Directly tied to revenue -- in ad systems, revenue = impressions x CTR x CPC. In e-commerce, revenue = impressions x CTR x CVR x AOV. Improving CTR directly improves the business.
Serves as both metric and prediction target -- you measure CTR to evaluate your system and predict CTR to build your ranking model. This alignment between evaluation and optimization is rare and powerful.
Enables continuous learning -- the feedback loop (show item -> observe click -> retrain model) allows the system to improve autonomously without human intervention.
Disadvantages
Confounded by position bias -- items at higher positions get more clicks regardless of relevance. Raw CTR overestimates the quality of top-positioned items and underestimates items shown lower. Debiasing is complex.
Encourages clickbait -- optimizing purely for CTR incentivizes sensational titles, misleading thumbnails, and curiosity-gap headlines that get clicks but disappoint users after clicking.
Does not capture post-click value -- a user who clicks and immediately bounces counts the same as a user who clicks and spends 30 minutes engaged. CTR alone cannot distinguish valuable clicks from wasted ones.
Noisy at small scale -- with few impressions, CTR estimates have wide confidence intervals. You need thousands of impressions per variant to detect meaningful CTR differences in A/B tests.
Creates feedback loops -- the model determines what gets shown, which determines what gets clicked, which determines the training data. This self-reinforcing loop can create filter bubbles and suppress exploration of new items.
Not comparable across surfaces -- a 5% CTR on a search result page means something very different from 5% CTR on a banner ad or 5% CTR on a push notification. Cross-surface comparison requires normalization.
Susceptible to click fraud and bots -- in ad systems, fraudulent clicks inflate CTR and cost advertisers money. Bot filtering and invalid traffic detection are necessary but imperfect.
Failure Modes & Debugging
Position bias inflation
Cause
Measuring CTR without correcting for the position at which items were shown. Items at position 1 receive 5-10x more clicks than the same item at position 5, purely due to visibility.
Symptoms
Items that have historically been ranked high appear to have high CTR (and therefore keep getting ranked high), while new or previously low-ranked items appear to have low CTR even if they are relevant. The system becomes self-reinforcing and exploration stops.
Mitigation
Implement position debiasing using Inverse Propensity Scoring (IPS). Run periodic randomization experiments (show items at random positions for 1% of traffic) to estimate position propensities. Use the examination hypothesis to factor out position effects. When comparing items, always compare at the same position or use debiased CTR.
Feedback loop / popularity bias
Cause
The CTR prediction model is trained on click data generated by a previous version of the model. Popular items that were shown frequently have abundant click data and appear high-quality, while new or niche items have sparse data and appear low-quality.
Symptoms
The recommendation system converges to showing only a small set of popular items. Catalog coverage drops over time. New items added to the catalog never get shown because the model has no data to predict their CTR. Users in minority segments receive increasingly irrelevant recommendations.
Mitigation
Add exploration to the serving system: epsilon-greedy (show random items X% of the time), Thompson sampling (sample from posterior CTR distribution), or contextual bandits. Use counterfactual learning (IPS-weighted loss) during training to correct for logging policy bias. Monitor catalog coverage and diversity metrics alongside CTR.
Clickbait optimization
Cause
Optimizing purely for CTR without guardrail metrics. The model learns that sensational titles, misleading thumbnails, and curiosity-gap formats generate more clicks, even though they lead to user dissatisfaction.
Symptoms
CTR increases but dwell time drops, bounce rate increases, user complaints rise, and long-term retention degrades. Content quality on the platform deteriorates as creators optimize for clickbait to get distribution.
Mitigation
Use a composite reward that combines CTR with post-click quality signals: CTR x dwell_time, CTR x (1 - bounce_rate), or CTR x satisfaction_score. Add guardrail metrics to A/B tests: any experiment that improves CTR but degrades dwell time or retention must be rejected. Implement content quality scoring as a re-ranking signal.
Impression counting errors
Cause
Inconsistent definition of what counts as an impression. Server-side logging counts an item as "shown" when it is included in the API response, but the user may never scroll to see it. Client-side logging may fire inconsistently due to JavaScript errors, ad blockers, or network issues.
Symptoms
CTR appears artificially low (because the denominator includes items the user never actually saw) or fluctuates inexplicably between releases. A/B test results are unreliable because impression counts differ between variants for non-ML reasons.
Mitigation
Define a strict viewability standard: an impression counts only when 50% of the item's pixels are visible in the viewport for at least 1 second. Implement both server-side and client-side logging and reconcile them. Use the client-side count for CTR computation but fall back to server-side when client-side is unavailable. Monitor the ratio of client-side to server-side impressions as a data quality metric.
Model calibration drift
Cause
The CTR prediction model's predicted probabilities diverge from actual CTR over time due to distribution shift (new users, new items, seasonal trends, UI changes). The model was calibrated at training time but becomes miscalibrated as the world changes.
Symptoms
In ad systems, revenue drops because overbidding (predicted CTR > actual) or underbidding (predicted CTR < actual) occurs. In recommendation systems, ranking quality degrades because the model's probability estimates no longer reflect reality. Log loss increases even if AUC remains stable.
Mitigation
Monitor calibration continuously: plot predicted CTR vs actual CTR in decile buckets. If the ratio diverges beyond a threshold (e.g., predicted/actual > 1.2 or < 0.8), trigger model retraining. Use isotonic regression or Platt scaling as a post-hoc calibration layer. Retrain models frequently (daily or hourly) on recent data to track distribution shifts.
Attribution window mismatch
Cause
Setting the click attribution window (how long after an impression a click counts) too short or too long. Too short: misses legitimate delayed clicks (user sees ad, returns later to click). Too long: attributes unrelated clicks to stale impressions.
Symptoms
With a short window: measured CTR is lower than true engagement, and the model underestimates item value. With a long window: measured CTR is inflated by noise, and the model attributes clicks to the wrong items. A/B test results are biased if control and treatment have different user journeys with different click delays.
Mitigation
Analyze the click delay distribution: plot the time between impression and click for your system. Set the attribution window to capture 95% of legitimate clicks (typically 30 minutes for search, 24 hours for display ads, 1-7 days for view-through attribution). Make the window a configurable parameter and run sensitivity analysis to understand how results change with different windows.
Placement in an ML System
CTR's Unique Position: Metric and Objective
CTR occupies a unique position in the ML pipeline because it serves three distinct roles:
1. Online Evaluation Metric: During A/B testing, CTR is the primary metric for comparing ranking algorithms. A new model that improves CTR by 1% relative (e.g., 4.00% to 4.04%) with statistical significance is considered a meaningful win at scale.
2. Model Training Objective: CTR prediction models are trained to minimize binary cross-entropy loss on click/no-click labels. The training data comes from the same impression-click logs used for measurement. This creates a tight loop between evaluation and optimization.
3. Real-Time Ranking Signal: In ad auctions, predicted CTR is a direct input to the ranking formula: score = bid x pCTR x quality_factor. The model's output is not just evaluated -- it determines what users see.
This triple role means CTR is deeply embedded in every layer of the system: data collection (impression/click logging), model training (click prediction), serving (ranking by pCTR), and evaluation (measuring actual CTR in A/B tests).
Key Insight: Unlike most ML metrics that sit outside the inference path (you compute NDCG after serving, not during), CTR prediction is part of the serving path. This means CTR model latency, calibration, and reliability directly affect user experience and revenue. A CTR model outage is a revenue outage.
Pipeline Stage
Evaluation / Online Metrics / Model Objective
Upstream
- Ranking / Recommendation Model
- Feature Store
- Impression Logging System
- Click Tracking System
- User Session Manager
Downstream
- A/B Test Analysis
- Model Retraining Pipeline
- Revenue Attribution
- Monitoring & Alerting Dashboard
- Business Intelligence Reports
Scaling Bottlenecks
The primary bottleneck is impression and click event ingestion. A platform with 100M daily active users showing 50 items per session generates ~5 billion impression events per day (~60K events/second average, 300K/second peak). Each event carries user ID, item ID, position, timestamp, and context -- roughly 500 bytes. That is 2.5 TB/day of raw event data.
For Indian platforms at scale: Flipkart during Big Billion Days handles 10x normal traffic (potentially 600K events/second). Hotstar during IPL cricket matches can spike to 1M+ concurrent users generating events simultaneously.
Infrastructure costs (AWS/Azure India regions):
- Kafka cluster for event streaming: INR 3-5 lakh/month (6K)
- Data lake storage (S3/ADLS): INR 50K-1 lakh/month for 2.5 TB/day
- Spark/Flink for join and aggregation: INR 2-4 lakh/month (4.8K)
- Real-time CTR computation (Redis + custom service): INR 1-2 lakh/month
- Total for mid-scale platform: INR 8-15 lakh/month (18K)
The CTR model must score potentially thousands of candidate items per user request within 20ms. For 100K requests/second, that is 100M model inferences per second. Key strategies:
- Two-stage ranking: A cheap model (logistic regression) reduces candidates from 10K to 100, then a heavy model (DeepFM/DCN) re-ranks the top 100.
- GPU batching: Batch requests across users and score with GPU inference (TensorRT on A10G instances). Throughput: 50K-200K inferences/second per GPU.
- Feature caching: Pre-compute and cache item features (updated hourly). Only user and context features are computed real-time.
- Model distillation: Distill a large model into a smaller one for serving. Trade some accuracy for 10x latency improvement.
Production Case Studies
Google's ad ranking system uses predicted CTR as a core component of the ad auction. The Quality Score, which determines ad position and cost-per-click, is heavily influenced by expected CTR. Google's CTR prediction evolved from logistic regression (early 2000s) to deep neural networks, processing hundreds of billions of features across user context, query intent, and ad creative. Their system handles trillions of ad impressions per year with per-request latency under 10ms.
Google Ads generates over $200 billion annual revenue. Improvements in CTR prediction directly translate to revenue: a 1% improvement in pCTR accuracy is estimated to be worth hundreds of millions of dollars annually. The Quality Score mechanism also improved user experience by showing more relevant ads.
Meta's 2014 paper by He et al. presents practical lessons from predicting clicks on ads at Facebook's scale (750M daily active users, 1M+ advertisers), introducing a model combining decision trees with logistic regression and exploring how fundamental parameters impact CTR prediction performance.
The combined decision tree and logistic regression model outperformed either method alone by over 3%, with the most important finding being that having the right features—especially historical information about users and ads—dominated other types of features.
Flipkart uses CTR prediction to personalize product search results. Their system combines query-product relevance features with user personalization signals (past browsing history, purchase patterns, price sensitivity). During Big Billion Days sales, the system handles 10x normal traffic with CTR models optimized for sale-specific user behavior (higher urgency, price sensitivity). They use a multi-objective optimization that balances CTR with conversion rate and gross merchandise value.
Personalized ranking based on CTR prediction improved click-to-cart conversion by 15% compared to relevance-only ranking. During Big Billion Days 2024, the system handled 50 million+ concurrent sessions. CTR-based re-ranking of search results was a key factor in Flipkart's search-driven revenue growth.
JD.com deployed DeepFM for CTR prediction in their product recommendation system, serving 300+ million active users. Their implementation extends the standard DeepFM with attention mechanisms for user behavior sequences (which products the user viewed in what order). The model processes real-time features from the user's current session combined with long-term preference features from historical data. They published their approach in the DeepFM paper and subsequent work on deep interest networks.
DeepFM improved CTR by 8.6% relative and conversion rate by 6.2% relative compared to their previous Wide & Deep model. The model serves recommendations on JD.com's homepage, product detail pages, and push notifications, collectively driving over 40% of JD.com's total transactions.
Swiggy uses CTR prediction to rank restaurants in the user's feed. Their CTR model incorporates features like user's cuisine preferences, order history, restaurant ratings, estimated delivery time, current time of day, and location-specific popularity. Position bias is a significant challenge: the first restaurant in the feed gets 5x more taps than the fifth. They implemented position debiasing and a multi-objective model that optimizes for tap CTR, menu-view rate, and order conversion simultaneously.
CTR-based restaurant ranking improved order conversion by 12% compared to a popularity-based baseline. The multi-objective approach prevented the system from over-indexing on clickbait restaurant images and ensured that high-converting restaurants (not just high-CTR ones) were promoted. Active in 500+ cities across India.
Tooling & Ecosystem
Provides log_loss and roc_auc_score for evaluating CTR prediction models offline. Also provides LogisticRegression which remains a strong baseline for CTR prediction. Useful for prototyping and baseline models before moving to deep learning.
A comprehensive Python library implementing 20+ deep CTR models: DeepFM, DCN (Deep & Cross Network), DIN (Deep Interest Network), DIEN, xDeepFM, AutoInt, and more. Built on TensorFlow/Keras with a clean API for training and evaluation. The go-to library for experimenting with deep CTR architectures.
Meta's open-source library for building large-scale recommendation and CTR prediction systems. Provides distributed embedding tables, pipelined training, and DLRM implementation. Designed for production-scale CTR systems processing billions of examples.
Gradient boosted trees widely used as CTR prediction models and for feature transformation (GBDT+LR pattern from Meta). Supports binary:logistic objective for CTR and calibration via Platt scaling. Excellent for tabular CTR features with moderate dimensionality.
Distributed event streaming platform used for real-time impression and click event ingestion. The backbone of CTR measurement infrastructure at scale. Handles millions of events per second with low latency. Used by virtually every large-scale CTR system.
Statistical libraries for A/B test analysis of CTR metrics. Provides proportion z-tests (proportions_ztest), Wilson confidence intervals, and power analysis. Essential for determining statistical significance of CTR differences between experiment variants.
Research & References
Guo, H., Tang, R., Ye, Y., Li, Z. & He, X. (2017)IJCAI 2017
Introduced DeepFM, which combines Factorization Machines (for learning feature interactions) with a deep neural network in a single end-to-end model. Eliminates the need for manual feature engineering. Became one of the most widely deployed deep CTR architectures in industry.
Wang, R., Fu, B., Fu, G. & Wang, M. (2017)AdKDD 2017
Proposed the Deep & Cross Network (DCN) that explicitly models feature interactions of bounded degree through a cross network, combined with a deep network. DCN-V2 (2020) improved the cross network with mixture of experts. Widely used at Google for ad CTR prediction.
He, X., Pan, J., Jin, O., Xu, T., Liu, B., Xu, T., Shi, Y., Atallah, A., Herbrich, R., Bowers, S. & Candela, J.Q. (2014)AdKDD 2014
Meta's influential paper on production CTR prediction. Introduced the GBDT+LR architecture (gradient boosted trees for feature transformation, logistic regression for prediction). Showed that data freshness matters more than model complexity, and that calibration is critical for ad auctions.
Zhou, G., Zhu, X., Song, C., Fan, Y., Zhu, H., Ma, X., Yan, Y., Jin, J., Li, H. & Gai, K. (2018)KDD 2018
Proposed DIN (Deep Interest Network) which uses an attention mechanism to adaptively learn user interest representations from historical behavior with respect to the candidate ad/item. The key insight: a user's diverse interests are not well captured by a single fixed-length vector.
Wang, X., Golbandi, N., Bendersky, M., Metzler, D. & Najork, M. (2018)WSDM 2018
Google's work on estimating and correcting position bias in click data for learning to rank. Proposes a regression-based EM algorithm to jointly estimate position bias and document relevance. Essential reading for anyone using click-based CTR data for model training.
Naumov, M., Mudigere, D., Shi, H.J.M., Huang, J., Sundaraman, N., Park, J., Wang, X., Gupta, U., Wu, C.J., Azzolini, A.G., et al. (2019)arXiv preprint
Meta's DLRM (Deep Learning Recommendation Model) architecture that became the industry standard for large-scale CTR and recommendation systems. Combines embedding tables for sparse categorical features with MLPs for dense features, using dot-product feature interactions. Open-sourced as part of TorchRec.
Interview & Evaluation Perspective
Common Interview Questions
- ●
What is CTR and how would you use it to evaluate a recommendation system?
- ●
How do you handle position bias when measuring CTR?
- ●
Explain the difference between CTR and conversion rate. When would you optimize for each?
- ●
Design a CTR prediction system for an ad platform. What features would you use?
- ●
Your model improves offline AUC but CTR drops in A/B testing. What went wrong?
- ●
How would you detect and prevent clickbait optimization in a content feed?
- ●
Walk me through the DeepFM architecture. Why does it work well for CTR?
- ●
How do you handle the cold-start problem for CTR prediction on new items?
Key Points to Mention
- ●
CTR = clicks / impressions. Simple formula, complex in practice. The complexity lies in position bias, impression counting, attribution windows, and feedback loops.
- ●
Position bias is the single biggest challenge in CTR measurement and prediction. Always mention IPS (Inverse Propensity Scoring) and the examination hypothesis when discussing CTR.
- ●
CTR should never be the only metric. Pair it with dwell time, conversion rate, and retention to avoid clickbait optimization. Use composite objectives: CTR x quality_score.
- ●
Deep CTR models (DeepFM, DCN, DIN) capture feature interactions automatically. The key innovation is combining explicit interaction modeling (FM/Cross layers) with deep representation learning.
- ●
Calibration matters as much as ranking quality. In ad systems, predicted CTR directly determines bids and revenue. A miscalibrated model loses money even with good AUC.
- ●
The feedback loop (model -> ranking -> clicks -> training data -> model) is a self-reinforcing system. Exploration (epsilon-greedy, Thompson sampling) is essential to prevent the system from converging to a local optimum.
Pitfalls to Avoid
- ●
Quoting raw CTR without acknowledging position bias. In any interview discussion, always caveat that raw CTR is confounded by position and needs debiasing for fair comparison.
- ●
Treating CTR prediction as a simple binary classification problem. It is binary classification with severe class imbalance (often 1-5% positive rate), position bias, feedback loops, and real-time latency requirements. Emphasize these challenges.
- ●
Ignoring calibration. Saying you would use AUC as the only metric for CTR model evaluation. AUC measures ranking, but calibration (predicted probability = actual probability) is equally important, especially in ad auctions.
- ●
Not discussing the feedback loop. A senior candidate must mention that the model determines what is shown, which determines the training data, which can create filter bubbles and popularity bias.
- ●
Conflating CTR with user satisfaction. A user might click out of confusion, curiosity, or accidental taps. High CTR does not necessarily mean the system is working well.
Senior-Level Expectation
A senior candidate should discuss CTR holistically: measurement infrastructure (impression logging, click tracking, attribution), prediction architecture (feature engineering, model choice, serving latency), evaluation methodology (A/B testing with statistical rigor, guardrail metrics), and failure modes (position bias, feedback loops, clickbait, calibration drift). They should articulate the tradeoff between CTR and long-term user satisfaction, propose multi-objective optimization approaches, and discuss how to instrument exploration to prevent the system from exploiting the feedback loop. They should know when CTR is the right metric and when it is not -- for example, recognizing that a content platform optimizing purely for CTR will degrade into clickbait. For India-specific systems, they should discuss challenges like low-bandwidth environments (where impressions may not log correctly), multilingual content (where CTR varies dramatically by language), and high device fragmentation (where CTR measurement on low-end Android devices is less reliable).
Summary
Here is a comprehensive recap of CTR and conversion metrics in ML systems:
CTR (Click-Through Rate) is the ratio of clicks to impressions -- the most fundamental online metric for any system that shows items to users. Its formula is trivially simple (), but measuring and predicting it correctly is remarkably complex. CTR uniquely serves three roles in the ML pipeline: as an evaluation metric (measuring system quality in A/B tests), as a prediction target (training models to estimate click probability), and as a ranking signal (using predicted CTR to order items in real-time). This triple role makes it deeply embedded in every layer of production ML systems, from data collection to model serving to business reporting.
The central challenges of CTR are position bias (items at higher positions get more clicks regardless of quality, requiring IPS debiasing), feedback loops (the model determines what is shown, creating self-reinforcing popularity bias), clickbait optimization (pure CTR optimization degrades content quality), and calibration (in ad systems, predicted CTR directly determines bids and revenue, so probability accuracy matters as much as ranking accuracy). Deep CTR models like DeepFM, DCN, and DIN address the prediction challenge by automatically learning feature interactions, but the measurement and evaluation challenges remain fundamentally about logging infrastructure, statistical methodology, and thoughtful metric design.
The key takeaway: CTR is necessary but not sufficient. Always pair it with downstream quality metrics (dwell time, conversion rate, retention) to ensure that click optimization translates to real user value. Use position debiasing for fair measurement, exploration for healthy feedback loops, and multi-objective optimization to prevent the system from degenerating into clickbait. CTR is the bridge between ML model output and business impact -- getting it right is what separates a good recommendation system from a great one.