Gaussian Generator in Machine Learning
A Gaussian Generator is one of the oldest and most reliable tools in the ML engineer's arsenal for producing synthetic data. At its core, it samples points from one or more Gaussian (normal) distributions -- univariate or multivariate -- to create datasets that mirror the statistical properties of real-world data.
Why does this matter? In many real-world scenarios -- early-stage startups with limited user data, healthcare applications constrained by privacy regulations, or financial systems where fraud examples are vanishingly rare -- you simply do not have enough real data. Gaussian generators fill that gap by producing statistically coherent synthetic samples that preserve the means, variances, and correlation structures of the original data.
The beauty of Gaussian generation lies in its mathematical tractability. Unlike deep generative models (GANs, VAEs, diffusion models) that are effectively black boxes, a Gaussian generator's output is completely characterized by two parameters: the mean vector and the covariance matrix. This makes it interpretable, auditable, and extremely fast.
From numpy.random.multivariate_normal powering quick prototypes to full-blown Gaussian Mixture Models (GMMs) capturing complex multi-modal distributions, Gaussian generators underpin everything from scikit-learn's make_classification benchmarks to production synthetic data pipelines at financial institutions like JPMorgan. If you have ever called np.random.randn(), you have already used a Gaussian generator.
Concept Snapshot
- What It Is
- A parametric data generation component that samples synthetic data points from one or more Gaussian (normal) distributions, specified by mean vectors and covariance matrices.
- Category
- Data Generation
- Complexity
- Beginner
- Inputs / Outputs
- Inputs: distribution parameters (mean vector, covariance matrix, optional mixture weights and component count) or a fitted dataset to estimate parameters from. Outputs: synthetic data samples as numerical arrays.
- System Placement
- Sits at the very beginning of an ML pipeline -- upstream of feature engineering, model training, and evaluation. Used during data preparation, benchmarking, testing, and augmentation phases.
- Also Known As
- Normal distribution sampler, Multivariate Gaussian sampler, GMM generator, Parametric synthetic data generator, Gaussian noise generator
- Typical Users
- ML Engineers, Data Scientists, Research Scientists, QA/Test Engineers, Statistical Modelers
- Prerequisites
- Probability distributions (normal/Gaussian), Linear algebra basics (vectors, matrices), Covariance and correlation concepts, Basic Python/NumPy
- Key Terms
- multivariate normalcovariance matrixCholesky decompositionGaussian Mixture Modelexpectation-maximizationmean vectorpositive semi-definitemarginal distributionparametric generation
Why This Concept Exists
The Data Scarcity Problem
ML algorithms are data-hungry. A fraud detection model needs thousands of fraud examples, but fraudulent transactions represent less than 0.2% of all transactions. A medical imaging classifier for rare diseases might have only 50-100 positive samples. An Indian fintech startup building a loan default predictor on day one has zero historical defaults.
In all of these cases, you need more data that is statistically representative of the real thing.
Why Gaussian? The Central Limit Theorem Connection
The Central Limit Theorem tells us that the sum of many independent random variables tends toward a Gaussian distribution. This is why heights, measurement errors, sensor readings, and financial returns over short intervals are approximately Gaussian.
This makes Gaussian generators a surprisingly effective first approximation. When you estimate the mean and covariance from a real dataset and sample from that fitted Gaussian, you capture the first two statistical moments -- often enough to produce useful synthetic samples.
The Evolution: From Simple to Mixture Models
Early parametric generators were single-component Gaussians: estimate and , then sample. This works for unimodal data, but real data is often multi-modal. Customer spending clusters into segments. Disease biomarkers form distinct subpopulations.
Gaussian Mixture Models (GMMs) solved this by modeling data as a weighted sum of multiple Gaussian components. The Expectation-Maximization (EM) algorithm, formalized by Dempster, Laird, and Rubin in 1977, provided an elegant fitting method. You could capture multi-modal distributions while retaining parametric speed and interpretability.
Historical Note: The Gaussian distribution was characterized by Gauss in 1809, but its use for systematic synthetic data generation in ML became widespread in the 2010s, driven by privacy-preserving data sharing and benchmark creation. Today, Gaussian generators remain the backbone of scikit-learn's dataset generators and the SDV library.
Core Intuition & Mental Model
The Mental Model: A Data Printing Press
Think of a Gaussian generator as a printing press for data. You show it a sample of real data, it learns the shape of the underlying cloud (how spread out, how tilted, how many clusters), and then it can print as many new data points as you want that look like they came from the same source.
The key insight is that the "shape" is fully captured by just two things: where the center is (the mean) and how the data spreads and correlates (the covariance matrix). If you tell me the average height and weight of adults in India and how strongly height and weight are correlated, I can generate realistic-looking height-weight pairs all day long. That's all a Gaussian generator does -- but in dimensions instead of two.
Why Covariance Matters More Than You Think
Here's where beginners go wrong. They generate each feature independently: height from one Gaussian, weight from another, income from a third. But real features are correlated. Taller people tend to weigh more. Higher income correlates with higher credit scores. If you ignore these correlations, your synthetic data will look statistically plausible one column at a time but will be obviously fake when you look at pairs of columns.
The covariance matrix is the secret sauce. It encodes all pairwise linear relationships between features. When you sample from a multivariate Gaussian with the correct covariance, the correlations come for free. This is what makes Gaussian generators fundamentally different from just calling random.gauss() on each column independently.
The Cholesky Trick
Under the hood, sampling from a multivariate Gaussian uses an elegant mathematical trick. You start with independent standard normal samples and then transform them using the Cholesky decomposition of the covariance matrix: , where . The matrix "bends" the independent samples into the correct correlated shape. It is like taking a perfectly round ball of clay and stretching it into an ellipsoid -- the Cholesky factor tells you exactly how much to stretch in each direction.
Expert Insight: If you understand that
numpy.random.multivariate_normalis essentially doingmean + cholesky(cov) @ standard_normals, you understand 90% of what a Gaussian generator does. The rest is engineering -- handling edge cases, estimating parameters, and scaling.
Technical Foundations
Univariate Gaussian
The simplest case. A random variable follows a Gaussian (normal) distribution with mean and variance :
The probability density function (PDF) is:
Multivariate Gaussian
For -dimensional data, a random vector follows a multivariate Gaussian with mean vector and covariance matrix :
The PDF is:
where is the determinant of . The covariance matrix must be symmetric positive semi-definite (all eigenvalues ).
Sampling via Cholesky Decomposition
To generate samples efficiently, decompose where is a lower-triangular matrix (Cholesky factor). Then:
This is per sample after the one-time decomposition.
Gaussian Mixture Model (GMM)
A GMM models data as a weighted combination of Gaussian components:
where are mixing weights with . Parameters are estimated via the Expectation-Maximization (EM) algorithm, which alternates between computing posterior responsibilities (E-step) and updating parameters (M-step). Convergence to a local optimum is guaranteed, though the global optimum is not.
Complexity Analysis
| Operation | Time Complexity | Space Complexity |
|---|---|---|
| Covariance estimation | ||
| Cholesky decomposition | ||
| Sample generation (per sample) | ||
| GMM EM fitting (per iteration) |
where is the number of training samples, is dimensionality, and is the number of mixture components.
Key Constraint: The covariance matrix must be positive semi-definite. In practice, numerical errors during estimation can produce matrices that are not PSD. Always validate with a Cholesky decomposition attempt and add a small regularization term (typically ) if it fails.
Internal Architecture
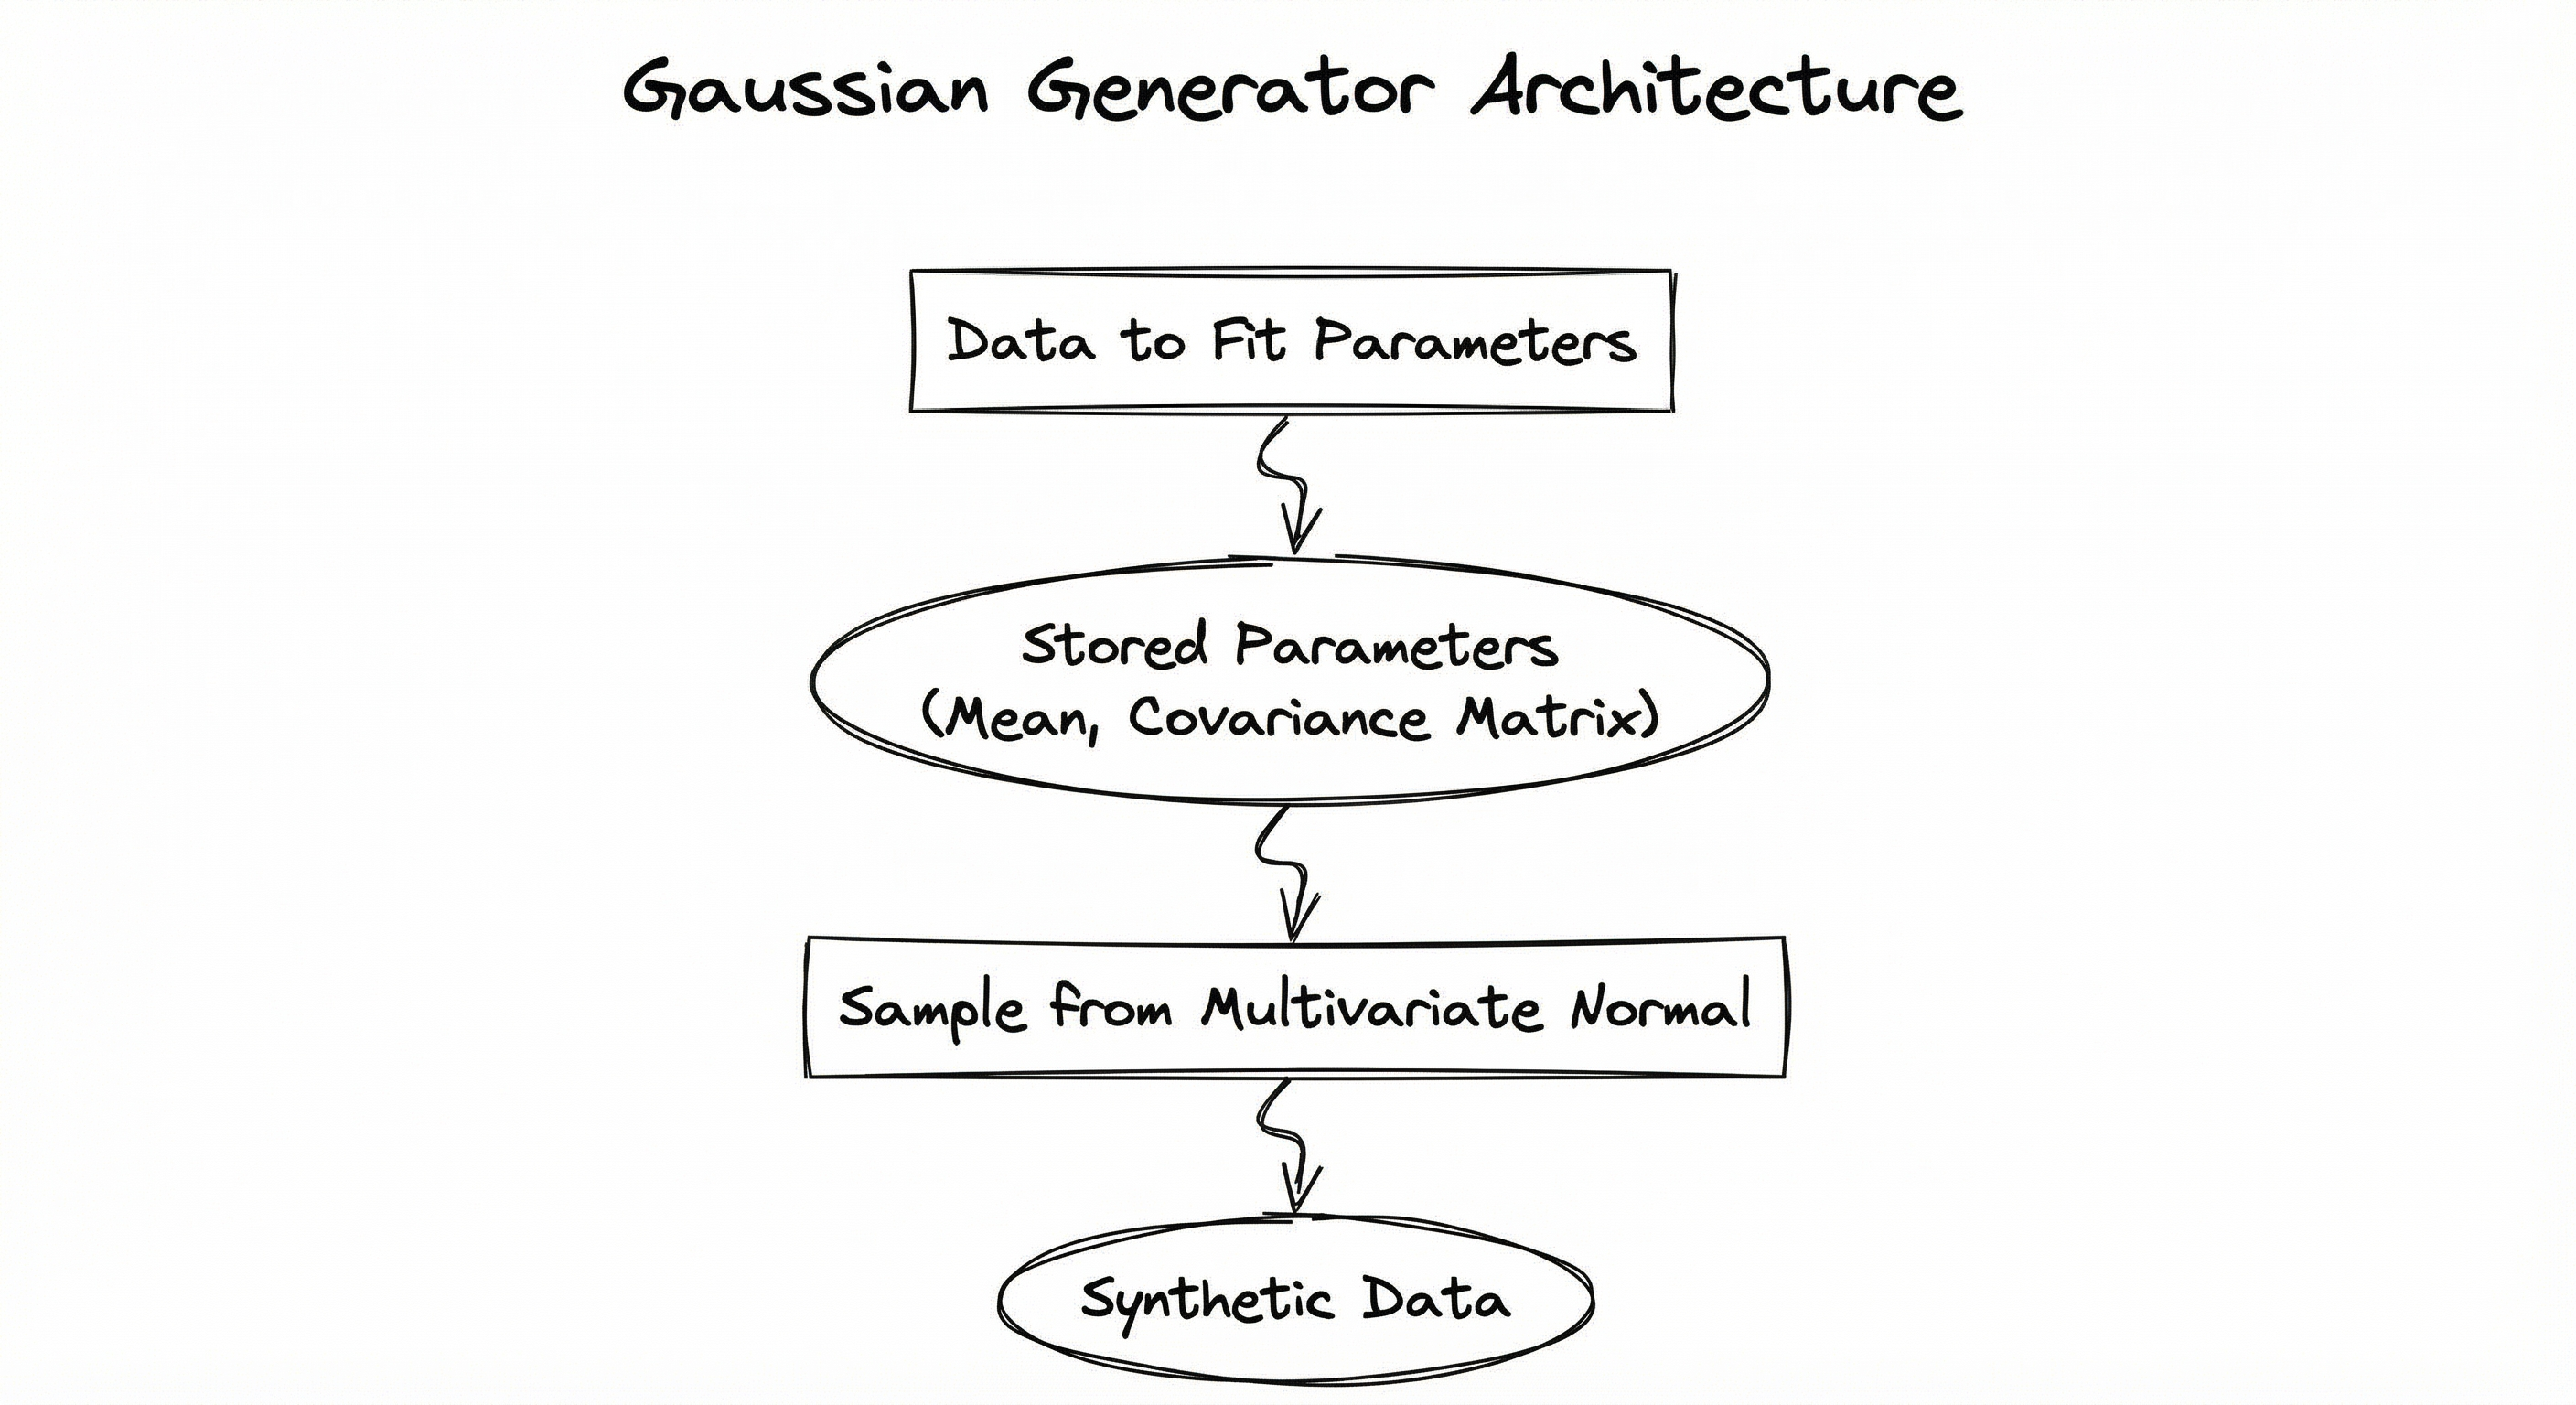
A Gaussian generator system in a production ML pipeline typically consists of four stages: parameter estimation from real data, model selection and validation, batch sample generation, and post-processing/quality checks. The pipeline can operate in two modes: fitted mode (learn parameters from a real dataset) or specified mode (accept explicit mean/covariance parameters from the user).
In fitted mode, the parameter estimator computes sample means and covariances from the input data. For GMMs, the EM algorithm determines the optimal number of components (often using BIC/AIC model selection). In specified mode, the user directly provides the distribution parameters, bypassing estimation entirely.
Key Components
Parameter Estimator
Computes the sample mean vector and sample covariance matrix from real data. For small samples, applies shrinkage estimators (Ledoit-Wolf or Oracle Approximating Shrinkage) to improve conditioning. Validates that is positive semi-definite.
Model Selector
Determines whether a single Gaussian or a GMM is appropriate. Uses Bayesian Information Criterion (BIC) or Akaike Information Criterion (AIC) to select the number of mixture components . Prevents overfitting by penalizing model complexity.
EM Fitter (GMM mode)
Runs the Expectation-Maximization algorithm to estimate mixture weights , component means , and component covariances . Handles convergence monitoring, random restarts, and covariance regularization to avoid singular components.
Cholesky Sampler
Decomposes the covariance matrix via Cholesky factorization () and generates samples as where . Falls back to SVD-based sampling if the Cholesky decomposition fails due to numerical issues.
Post-Processor
Applies domain-specific constraints to generated samples: clips values to valid ranges (e.g., age cannot be negative), rounds integer-valued features, enforces business rules (e.g., credit limit >= 0), and optionally adds differential privacy noise.
Quality Validator
Compares statistical properties of synthetic vs. real data: column-wise KS tests, pairwise correlation comparison, distributional divergence metrics (Jensen-Shannon divergence), and optional downstream utility checks.
Data Flow
Fitted Mode: Real dataset enters the Parameter Estimator, which computes and . The Model Selector determines if a single Gaussian or GMM is needed. Parameters flow to the appropriate sampler (Cholesky for single, EM + component sampling for GMM). Raw samples pass through the Post-Processor for constraint enforcement, then the Quality Validator runs statistical tests.
Specified Mode: The user provides , (and optionally , ) directly. The pipeline skips estimation and goes straight to the Cholesky Sampler. This mode is common for synthetic benchmarks and unit tests.
Batch Generation: For large-scale generation (millions of samples), the sampler operates in configurable batch sizes to manage memory. A typical batch is 10,000-100,000 samples, with each batch independently generated and concatenated.
A directed flow from 'Real Data / Config' to 'Parameter Estimator', which branches to either 'Cholesky Sampler' (single Gaussian) or 'EM Fitting' then 'Component Sampler' (GMM). Both paths converge at a 'Post-Processor' which feeds into a 'Synthetic Dataset' and then a 'Quality Validator'.
How to Implement
Two Primary Approaches
Implementation falls into two categories based on complexity:
Approach 1: Direct NumPy/SciPy Sampling -- Use numpy.random.multivariate_normal or scipy.stats.multivariate_normal for single-component Gaussian generation. This is the right choice for benchmarks, unit tests, and simple augmentation. Zero dependencies beyond NumPy.
Approach 2: GMM-based Generation with scikit-learn or SDV -- Use sklearn.mixture.GaussianMixture or the Synthetic Data Vault's GaussianCopulaSynthesizer for multi-modal, multi-column tabular data generation. Better for production synthetic data where the underlying distribution is complex.
For teams in India working on early-stage products, Approach 1 is often sufficient and adds no infrastructure overhead. A Bengaluru fintech building a loan prediction model can generate synthetic financial profiles with np.random.multivariate_normal in 3 lines of code. For enterprise use cases requiring privacy compliance (DPDP Act, RBI guidelines), the SDV library provides audit trails and quality metrics out of the box.
Cost Note: All core tools are open-source and run locally. A 16GB laptop can generate 10 million samples with 50 features in under 30 seconds. Cloud cost is effectively zero (INR 0 / 0.30/hour) handles most workloads comfortably.
import numpy as np

# Define distribution parameters
mean = np.array([170.0, 70.0, 50000.0])  # height(cm), weight(kg), income(INR k)
cov = np.array([
    [100.0,  30.0,   500.0],   # height variance and covariances
    [ 30.0,  80.0,   200.0],   # weight variance and covariances
    [500.0, 200.0, 90000.0],   # income variance and covariances
])

# Generate 10,000 synthetic samples
rng = np.random.default_rng(seed=42)
samples = rng.multivariate_normal(mean, cov, size=10_000)

# Verify statistics match
print(f"Sample mean:  {samples.mean(axis=0).round(1)}")
print(f"True mean:    {mean}")
print(f"Sample corr:\n{np.corrcoef(samples.T).round(3)}")
This is the simplest possible Gaussian generator. We specify a 3-dimensional mean and covariance matrix representing height, weight, and income for a synthetic Indian adult population. The default_rng provides the modern NumPy random API with better statistical properties than the legacy np.random.multivariate_normal. The generated samples will preserve the specified correlations -- taller people will tend to have higher weight and income in the synthetic data, just as they do in the real parameters.
import numpy as np

def gaussian_generator_cholesky(
    mean: np.ndarray,
    cov: np.ndarray,
    n_samples: int,
    seed: int = 42,
    regularization: float = 1e-6,
) -> np.ndarray:
    """Generate multivariate Gaussian samples via Cholesky decomposition.

    Args:
        mean: Mean vector of shape (d,)
        cov: Covariance matrix of shape (d, d)
        n_samples: Number of samples to generate
        seed: Random seed for reproducibility
        regularization: Small value added to diagonal for numerical stability

    Returns:
        Samples of shape (n_samples, d)
    """
    rng = np.random.default_rng(seed)
    d = len(mean)

    # Add regularization for numerical stability
    cov_reg = cov + regularization * np.eye(d)

    # Cholesky decomposition: Sigma = L @ L.T
    try:
        L = np.linalg.cholesky(cov_reg)
    except np.linalg.LinAlgError:
        # Fallback: use SVD-based approach if Cholesky fails
        U, s, Vt = np.linalg.svd(cov_reg)
        s = np.maximum(s, 0)  # Clip negative eigenvalues
        L = U * np.sqrt(s)

    # Generate standard normal samples
    z = rng.standard_normal(size=(n_samples, d))

    # Transform: x = mu + L @ z.T
    samples = mean + z @ L.T

    return samples

# Usage
mean = np.array([5.0, 3.0])
cov = np.array([[2.0, 0.8], [0.8, 1.5]])
data = gaussian_generator_cholesky(mean, cov, n_samples=5000)
print(f"Generated shape: {data.shape}")
print(f"Empirical mean: {data.mean(axis=0).round(3)}")
print(f"Empirical cov:\n{np.cov(data.T).round(3)}")
This implementation exposes what numpy.random.multivariate_normal does internally. The Cholesky decomposition transforms independent standard normal samples into correlated samples. The regularization term ( added to the diagonal) prevents failures when the covariance matrix is numerically near-singular -- a common problem when estimating covariance from small datasets. The SVD fallback handles the rare case where even regularized Cholesky fails.
import numpy as np
from sklearn.mixture import GaussianMixture
from sklearn.datasets import make_classification

# Create a multi-modal real dataset (simulating customer segments)
X_real, y_real = make_classification(
    n_samples=5000,
    n_features=8,
    n_informative=6,
    n_clusters_per_class=3,
    n_classes=2,
    random_state=42,
)

# Fit GMM with BIC-based model selection
best_bic = np.inf
best_gmm = None
for k in range(2, 12):
    gmm = GaussianMixture(
        n_components=k,
        covariance_type='full',
        n_init=5,
        random_state=42,
    )
    gmm.fit(X_real)
    bic = gmm.bic(X_real)
    if bic < best_bic:
        best_bic = bic
        best_gmm = gmm

print(f"Best K: {best_gmm.n_components}, BIC: {best_bic:.1f}")

# Generate synthetic samples
X_synthetic, component_labels = best_gmm.sample(n_samples=10_000)

# Validate: compare column means and standard deviations
print(f"Real means:      {X_real.mean(axis=0)[:4].round(3)}")
print(f"Synthetic means: {X_synthetic.mean(axis=0)[:4].round(3)}")
print(f"Real stds:       {X_real.std(axis=0)[:4].round(3)}")
print(f"Synthetic stds:  {X_synthetic.std(axis=0)[:4].round(3)}")
This example demonstrates the full GMM-based generation pipeline: fit multiple GMM models with different component counts, select the best via BIC (Bayesian Information Criterion), then sample from the fitted model. The covariance_type='full' allows each component to have its own full covariance matrix, capturing per-cluster correlation structure. Using n_init=5 runs the EM algorithm 5 times with different initializations to avoid bad local optima. The component_labels output tells you which mixture component each synthetic sample came from -- useful for debugging.
import pandas as pd
from sdv.single_table import GaussianCopulaSynthesizer
from sdv.metadata import SingleTableMetadata
from sdv.evaluation.single_table import evaluate_quality

# Prepare real data (e.g., Indian customer transactions)
real_data = pd.DataFrame({
    'customer_id': range(1, 1001),
    'age': np.random.randint(18, 70, 1000),
    'monthly_income_inr': np.random.lognormal(10.5, 0.8, 1000).astype(int),
    'credit_score': np.random.normal(720, 60, 1000).clip(300, 900).astype(int),
    'loan_amount_inr': np.random.lognormal(12, 1.2, 1000).astype(int),
    'is_default': np.random.binomial(1, 0.05, 1000),
})

# Define metadata
metadata = SingleTableMetadata()
metadata.detect_from_dataframe(real_data)
metadata.update_column('customer_id', sdtype='id')
metadata.set_primary_key('customer_id')

# Fit Gaussian Copula synthesizer
synthesizer = GaussianCopulaSynthesizer(
    metadata,
    enforce_min_max_values=True,
    enforce_rounding=True,
    numerical_distributions={
        'monthly_income_inr': 'gamma',
        'credit_score': 'truncated_gaussian',
    },
)
synthesizer.fit(real_data)

# Generate synthetic data
synthetic_data = synthesizer.sample(num_rows=5000)

# Evaluate quality
quality_report = evaluate_quality(
    real_data,
    synthetic_data,
    metadata,
)
print(f"Overall quality score: {quality_report.get_score():.3f}")
The SDV GaussianCopulaSynthesizer is a production-grade wrapper around Gaussian Copula models. It handles the messy parts: converting categorical and datetime columns via Reversible Data Transforms (RDTs), learning marginal distributions per column, and modeling dependencies via the copula. The numerical_distributions parameter lets you override the default Gaussian assumption for columns that follow known non-Gaussian distributions (like income, which is often log-normal). The quality evaluation uses column-wise statistical tests and pairwise correlation comparison to score the synthetic data.
from sklearn.datasets import make_classification, make_blobs, make_regression
import numpy as np

# 1. Classification benchmark with Gaussian clusters
X_clf, y_clf = make_classification(
    n_samples=10_000,
    n_features=20,
    n_informative=12,
    n_redundant=4,
    n_clusters_per_class=2,
    class_sep=1.5,
    flip_y=0.03,          # 3% label noise
    weights=[0.7, 0.3],   # imbalanced classes
    random_state=42,
)
print(f"Classification: X={X_clf.shape}, class balance={np.bincount(y_clf)}")

# 2. Clustering benchmark with known Gaussian blobs
X_blobs, y_blobs = make_blobs(
    n_samples=5_000,
    n_features=10,
    centers=5,
    cluster_std=[0.8, 1.2, 0.5, 1.0, 0.7],
    random_state=42,
)
print(f"Blobs: X={X_blobs.shape}, clusters={np.unique(y_blobs)}")

# 3. Regression benchmark with Gaussian noise
X_reg, y_reg = make_regression(
    n_samples=8_000,
    n_features=15,
    n_informative=10,
    noise=20.0,            # Gaussian noise std
    random_state=42,
)
print(f"Regression: X={X_reg.shape}, y range=[{y_reg.min():.1f}, {y_reg.max():.1f}]")
scikit-learn's dataset generators are built on Gaussian primitives. make_classification places Gaussian clusters at hypercube vertices and adds linear transforms plus noise. make_blobs generates isotropic Gaussian blobs -- perfect for testing clustering algorithms. make_regression uses Gaussian noise on a linear model. These are the standard way to create reproducible benchmarks for ML papers and experiments. The class_sep parameter in make_classification controls how far apart the Gaussian clusters are -- lower values make the classification harder.
# Gaussian Generator YAML config (production pipeline)
generator:
  type: gaussian_mixture
  n_components: auto          # Uses BIC to select K
  max_components: 15
  covariance_type: full        # Options: full, tied, diag, spherical
  n_init: 10                   # EM restarts
  regularization: 1e-6         # Diagonal regularization
  random_seed: 42

sampling:
  n_samples: 100000
  batch_size: 10000
  post_processing:
    clip_ranges:
      age: [0, 120]
      income_inr: [0, null]    # Non-negative, no upper bound
      credit_score: [300, 900]
    round_columns:
      - age
      - credit_score
    enforce_constraints:
      - "loan_amount <= 50 * monthly_income"

validation:
  ks_test_threshold: 0.05
  correlation_tolerance: 0.1
  min_quality_score: 0.85
Common Implementation Mistakes
- ●
Assuming independence between features: Generating each column independently with
np.random.normal()instead of using a joint multivariate Gaussian. This destroys inter-feature correlations and produces synthetic data where features are unrealistically independent. Always usemultivariate_normalwith the full covariance matrix. - ●
Not validating covariance matrix is PSD: Manually constructing or modifying a covariance matrix can easily produce a matrix that is not positive semi-definite. NumPy's Cholesky will raise
LinAlgError, but if you use SVD sampling, you'll silently get incorrect results. Always check withnp.linalg.cholesky()before using. - ●
Using sample covariance from tiny datasets: With (fewer samples than features), the sample covariance matrix is singular and cannot be inverted or decomposed. Use shrinkage estimators (
sklearn.covariance.LedoitWolf) or reduce dimensionality before estimating covariance. - ●
Forgetting to clip/constrain generated values: A Gaussian has infinite support -- it can generate negative ages, incomes above , or credit scores of 2000. Always post-process synthetic samples to enforce domain-valid ranges.
- ●
Overfitting GMM to small data: Using too many mixture components on a small dataset causes individual components to collapse onto single data points, effectively memorizing the training data. This defeats the purpose of synthetic generation and can leak sensitive information. Use BIC/AIC for model selection and cap .
- ●
Ignoring non-Gaussian marginals: Real-world features often have skewed or heavy-tailed distributions (income, transaction amounts). A raw Gaussian generator will produce symmetric distributions. Either transform the data first (log-transform, Box-Cox) or use a Gaussian Copula that models marginals separately.
When Should You Use This?
Use When
You need a quick, interpretable synthetic data generator for prototyping or benchmarking -- Gaussian generators require no GPU, no training loop, and produce results in milliseconds
Your data is approximately Gaussian or can be transformed to be Gaussian (e.g., log-normal income becomes Gaussian after log transform)
You need to preserve correlation structure between features while generating new samples -- the covariance matrix naturally captures linear dependencies
You are creating benchmark datasets for testing ML algorithms (most scikit-learn benchmarks use Gaussian primitives under the hood)
Privacy constraints prevent sharing real data but you can share the estimated mean and covariance -- these aggregate statistics are much safer to release than individual records
You need reproducible, seeded generation where the same parameters always produce the same output -- essential for unit tests and CI pipelines
Your dataset has fewer than ~50 features and the relationships between features are primarily linear -- Gaussian models excel in this regime
Avoid When
Your data has heavy non-linear dependencies (e.g., XOR-like patterns, hierarchical structures, or complex interactions) that a Gaussian covariance matrix cannot capture
You are working with image, text, or audio data where the underlying manifold is far from Gaussian -- use GANs, VAEs, or diffusion models instead
Your features have highly non-Gaussian marginal distributions (bimodal, heavy-tailed, or discrete with many categories) and transforming them to Gaussian is impractical
You need synthetic data that captures temporal dependencies or sequential patterns -- Gaussian generators produce i.i.d. samples with no notion of ordering. Use a time series generator instead
Privacy is critical and you cannot risk that the Gaussian parameters might leak information about individual records -- consider differential privacy mechanisms or fully synthetic approaches
Your data has more features than samples (), making covariance estimation ill-conditioned even with shrinkage -- dimensionality reduction or regularized approaches are needed first
Key Tradeoffs
Speed vs. Expressiveness
Gaussian generators are the fastest parametric generators available -- generating 1 million samples with 50 features takes about 2 seconds on a modern laptop. But they can only model linear relationships and elliptical distributions. Deep generative models (GANs, VAEs) can capture arbitrary distributions but require GPU training and are 100-1000x slower to fit.
| Method | Fit Time (1M x 50) | Sample Time (1M) | Captures Non-linear? |
|---|---|---|---|
| Single Gaussian | ~0.5s | ~2s | No |
| GMM (K=10) | ~30s | ~3s | Partially (piecewise) |
| CTGAN | ~20 min (GPU) | ~60s | Yes |
| Diffusion Model | ~2 hours (GPU) | ~5 min | Yes |
Interpretability vs. Fidelity
A Gaussian generator's parameters are fully interpretable: you can inspect the mean, covariance, and mixture weights. This is a huge advantage for auditing and debugging. But for complex real-world data, a GMM with even 20 components will not match the fidelity of a well-trained CTGAN. The question is whether that extra fidelity matters for your use case.
Privacy vs. Utility
Sharing and estimated from real data is not inherently private -- with enough features and a small enough dataset, these parameters can leak information about individual records. Adding Gaussian noise to the parameters provides (, )-differential privacy, but reduces the statistical fidelity of the generated data. For most Indian startups operating under the DPDP Act 2023, a Gaussian Copula with reasonable sample sizes (>1000) and aggregated parameters provides a practical privacy-utility balance.
Rule of Thumb: Start with a single multivariate Gaussian. If column-wise KS test p-values drop below 0.05 or pairwise correlations deviate by more than 0.1, upgrade to a GMM. If the GMM still cannot capture the structure, move to a Gaussian Copula (which handles non-Gaussian marginals) or a deep generative model.
Alternatives & Comparisons
A Copula Generator separates the modeling of marginal distributions from the dependency structure, using a copula function (often Gaussian) for the latter. Choose the Copula Generator when features have non-Gaussian marginals (skewed, heavy-tailed, discrete) but you still want Gaussian-like dependency modeling. A raw Gaussian generator forces all marginals to be Gaussian, which is more restrictive but simpler and faster.
GANs learn arbitrary data distributions through adversarial training and can capture complex non-linear patterns that Gaussians cannot. Choose a GAN when your data has non-linear dependencies, multi-modal structure that exceeds what a GMM can model, or when you need to generate images/audio. Choose a Gaussian generator when speed, interpretability, and determinism matter more than capturing every nuance of the distribution.
VAEs learn a smooth latent space from which new samples can be drawn, often assuming a Gaussian prior in latent space. The key difference is that VAEs learn a non-linear mapping from latent Gaussians to data space, while a Gaussian generator operates directly in data space. VAEs are better for complex data but harder to train and less interpretable.
CTGAN (Conditional Tabular GAN) is specifically designed for tabular data with mixed types. It uses mode-specific normalization to handle multi-modal continuous columns and a conditional generator for categorical columns. Choose CTGAN when your tabular data has complex, non-Gaussian distributions. Choose a Gaussian generator when your data is primarily numerical and approximately Gaussian, or when you need 100x faster generation.
Faker produces rule-based fake data (names, addresses, phone numbers, emails) using templates, not statistical distributions. It preserves no distributional properties of real data. Choose Faker when you need realistic-looking PII for testing UIs or demos. Choose a Gaussian generator when you need statistically representative numerical data that mirrors real-world distributions.
Pros, Cons & Tradeoffs
Advantages
Blazing fast: Generating 1 million multivariate samples takes seconds on CPU. No GPU required, no training loop. This makes it ideal for CI/CD pipelines, unit tests, and rapid prototyping.
Fully interpretable: The entire model is described by and -- you can inspect, audit, and explain every aspect of the generated data. No black box.
Mathematically principled: Backed by centuries of statistical theory. Convergence properties, confidence intervals, and hypothesis tests are all well-understood. You know exactly what you are getting.
Preserves correlation structure: The covariance matrix naturally captures all pairwise linear dependencies. Generated features are correlated in the same way as the original data, not independently random.
Reproducible and deterministic: Given the same parameters and random seed, you get identical output every time. Essential for reproducible research and deterministic testing.
Minimal dependencies: Works with just NumPy -- no special libraries, no model weights, no serialized artifacts. The "model" is just two arrays ( and ).
Scales to high dimensions: With efficient Cholesky decomposition, generation scales as per sample. Practical for datasets with hundreds of features.
Disadvantages
Cannot capture non-linear dependencies: Only models linear correlations. XOR-like patterns, interaction effects, and non-monotonic relationships are invisible to a Gaussian model.
Assumes elliptical distribution shape: All Gaussian contours are ellipses. Real data often has banana-shaped, L-shaped, or irregular density regions that Gaussians cannot represent.
Infinite support problem: Gaussians extend to , generating impossible values (negative ages, impossibly large incomes). Post-processing is always needed for bounded features.
Covariance estimation degrades in high dimensions: When approaches or exceeds , the sample covariance becomes unreliable or singular. Shrinkage estimators help but do not fully solve the problem.
GMM scalability limits: EM fitting with full covariance matrices scales as per iteration. For with many components, this becomes slow -- minutes to hours on CPU.
No handling of discrete/categorical data: Raw Gaussian generators only produce continuous values. Categorical features require separate handling (one-hot encoding, quantile transforms) that can introduce artifacts.
Failure Modes & Debugging
Singular covariance matrix
Cause
Estimating covariance from a dataset with fewer samples than features (), or from data with perfectly correlated or constant columns. The resulting matrix has zero eigenvalues and cannot be Cholesky-decomposed.
Symptoms
numpy.linalg.LinAlgError: Matrix is not positive definite during sampling. If using SVD fallback without validation, samples may have collapsed dimensions (zero variance in some directions).
Mitigation
Use shrinkage estimators: sklearn.covariance.LedoitWolf() or OAS() automatically regularize the covariance. Alternatively, add diagonal regularization with . Remove constant or perfectly collinear columns before estimation.
Distribution mismatch (non-Gaussian data)
Cause
Fitting a Gaussian model to data with skewed, heavy-tailed, or multi-modal marginal distributions. Common with financial data (income, transaction amounts), duration data, and count data.
Symptoms
Generated data fails column-wise Kolmogorov-Smirnov tests. Histograms of synthetic vs. real data show visible shape differences. Downstream models trained on synthetic data underperform compared to training on real data.
Mitigation
Apply variance-stabilizing transforms before fitting: log-transform for right-skewed data, Box-Cox for general skew. For multi-modal data, upgrade to a GMM. For mixed marginals, use a Gaussian Copula (SDV GaussianCopulaSynthesizer) that models each marginal independently.
GMM overfitting / component collapse
Cause
Using too many mixture components () relative to the dataset size. Individual components collapse onto single data points or tiny clusters, effectively memorizing the training data.
Symptoms
Generated data looks suspiciously close to specific training samples (near-duplicate rows). BIC/AIC increases with more components instead of following a U-shaped curve. Privacy analysis shows high re-identification risk.
Mitigation
Always use BIC or AIC for model selection -- never set manually without validation. Enforce minimum component weight () and minimum component eigenvalue. For privacy-critical applications, validate with nearest-neighbor distance ratio (DCR) between synthetic and real data.
Correlation drift after post-processing
Cause
Aggressively clipping generated values to enforce domain constraints (e.g., clipping income to [0, 5_000_000]) distorts the tail regions, altering pairwise correlations and marginal statistics.
Symptoms
Pre-clip correlation matrix matches the original; post-clip correlation matrix diverges, especially for features with heavy clipping. Mean and variance of clipped columns shift toward the clip boundaries.
Mitigation
Use rejection sampling instead of clipping: generate a larger batch, discard out-of-range samples, keep only valid ones. Alternatively, transform features to have natural bounds before fitting (e.g., logit transform for [0, 1] bounded features).
Privacy leakage through parameters
Cause
Releasing and estimated from sensitive data without privacy protection. With small datasets, these aggregate statistics can be combined with auxiliary information to infer individual records.
Symptoms
Membership inference attacks succeed at above-chance rates. Individual records from the training set can be approximately reconstructed from the published parameters.
Mitigation
Apply differential privacy noise to the estimated parameters before publishing or using them for generation. The Gaussian mechanism adds calibrated noise: where is calibrated to the sensitivity and desired . Libraries like OpenDP and Google's dp-accounting provide ready-to-use implementations.
Placement in an ML System
Where Does a Gaussian Generator Sit in the Pipeline?
In a typical ML pipeline, the Gaussian generator operates during the data preparation phase -- after raw data has been ingested and validated, but before feature engineering and model training.
Use Case 1: Augmentation. When the real dataset is small or imbalanced, a Gaussian generator creates additional samples to supplement the training data. This is particularly common in Indian fintech, where a new lender might have only 500 loan records but needs thousands for reliable model training.
Use Case 2: Benchmarking. Before building a real ML pipeline, teams generate synthetic datasets with known properties to test feature engineering code, model training scripts, and evaluation metrics. The Gaussian generator provides controlled data where the ground truth is known.
Use Case 3: Privacy-preserving data sharing. Instead of sharing real customer data between teams or organizations, the Gaussian generator produces synthetic data that preserves statistical properties. This is increasingly important under India's Digital Personal Data Protection Act, 2023 and RBI's data localization guidelines.
Key Insight: The Gaussian generator is a data multiplier, not a data replacement. It works best when combined with real data, not as a substitute for data collection. Think of it as filling gaps, not building the foundation.
Pipeline Stage
Data Preparation / Augmentation
Upstream
- batch-data-source
- feature-store
- data-validator
Downstream
- feature-engineering
- model-training
- smote
- data-validator
Scaling Bottlenecks
The primary bottleneck is covariance estimation and decomposition for high-dimensional data. Estimating a covariance matrix from samples is , and the Cholesky decomposition is . For features, the decomposition alone takes ~0.3 seconds. For , it takes ~300 seconds and requires ~800 MB just for the covariance matrix.
Sample generation is rarely the bottleneck -- it is per sample, which means 1 million samples at takes about 2 seconds.
For GMMs, the bottleneck shifts to EM convergence: each iteration is , and EM typically needs 50-200 iterations. With , , , each iteration takes ~4 seconds, so total fitting is 3-13 minutes.
Memory is the other concern: storing a full covariance matrix for features requires 800 MB of float64. For a GMM with components, that is 16 GB just for the covariance matrices. Use diagonal or tied covariance types to reduce this.
Production Case Studies
JPMorgan's AI Research team developed Gaussian Copula-based synthetic data generators for financial tabular data -- transaction records, customer profiles, and risk metrics. The approach models marginal distributions individually and uses a Gaussian copula to capture dependencies, generating privacy-safe synthetic datasets for internal model development and regulatory stress testing.
Enabled cross-team data sharing without exposing real customer PII. Synthetic datasets preserved statistical properties within 5% of real data correlations, accelerating model development cycles by 3-4 weeks per project. Published research on synthetic data generation in finance through their AI Research division.
Google Research used Gaussian-based differentially private synthetic data generation for safe content classification. They estimated aggregate statistics (means, covariances) from real user data, added calibrated Gaussian noise for differential privacy guarantees, and generated synthetic training data that protected individual user privacy while maintaining model utility.
Achieved (, )-differential privacy guarantees while maintaining >90% of the classification accuracy compared to models trained on real data. The approach has been deployed for multiple Google applications where user data privacy is critical.
The FCA's Synthetic Data Expert Group published a comprehensive report on using Gaussian and Gaussian Copula methods for generating synthetic financial datasets. The initiative explored how regulated financial institutions could share synthetic versions of sensitive datasets for research and model validation, with Gaussian Copula models identified as a practical baseline for tabular financial data.
The report established best practices for synthetic data quality assessment in financial services, recommending Gaussian Copula models as a starting point for institutions beginning their synthetic data journey. It influenced regulatory guidance across multiple jurisdictions including the Reserve Bank of India's consultation papers on data sharing.
Indian payment gateway Razorpay uses synthetic data generation based on parametric models (including Gaussian generators) for testing fraud detection models. With real fraud cases representing less than 0.1% of transactions, Gaussian-based augmentation of minority-class features helps balance training datasets for their anomaly detection systems. The approach generates synthetic fraud patterns that preserve the statistical signature of real fraudulent transactions.
Improved fraud detection recall by approximately 15% on held-out test sets compared to training on imbalanced real data alone. Reduced dependency on real fraud cases for model iteration, enabling faster experimentation cycles -- from bi-weekly to twice-weekly model updates.
Tooling & Ecosystem
The foundational library for Gaussian sampling in Python. numpy.random.Generator.multivariate_normal() provides the core multivariate Gaussian sampler with Cholesky, SVD, and eigenvalue decomposition methods. The modern default_rng() API offers better statistical properties than the legacy interface.
Provides GaussianMixture for GMM fitting and sampling, plus make_classification, make_blobs, make_regression for Gaussian-based benchmark dataset generation. Also includes covariance estimators (LedoitWolf, OAS, EmpiricalCovariance) for robust parameter estimation.
Production-grade synthetic data library from MIT's Data to AI Lab. The GaussianCopulaSynthesizer models marginal distributions independently and uses a Gaussian copula for dependencies -- the best of both worlds. Handles mixed data types, constraints, and includes built-in quality evaluation.
scipy.stats.multivariate_normal provides a full distribution object with rvs() (sampling), pdf(), logpdf(), and cdf() methods. More feature-rich than NumPy for statistical analysis of the fitted distribution, including log-likelihood computation.
Open-source library for synthetic data generation with differentially private options. Supports Gaussian-based and deep learning-based generators. Includes built-in privacy metrics and quality reports. The cloud platform adds managed infrastructure for enterprise deployments.
Differential privacy library that provides calibrated noise mechanisms for Gaussian parameter release. Use this when you need formal (, )-differential privacy guarantees on the mean and covariance estimates before generating synthetic data.
Research & References
Dempster, A.P., Laird, N.M., Rubin, D.B. (1977)Journal of the Royal Statistical Society, Series B
The foundational paper for the Expectation-Maximization algorithm, which is the standard method for fitting Gaussian Mixture Models. Introduced the iterative E-step/M-step framework that guarantees monotonic likelihood improvement.
Lu, Y., Shen, M., Wang, H., Wang, X., van Rechem, C., Wei, W. (2024)arXiv preprint (updated 2024)
Comprehensive survey covering parametric (Gaussian, GMM, Copula) and deep generative (GAN, VAE, Diffusion) approaches to synthetic data generation. Compares quality metrics and identifies Gaussian-based methods as the most practical for tabular data in resource-constrained settings.
Assefa, S.A., Dervovic, D., Mahfouz, M., Tillman, R.E., Reddy, P., Veloso, M. (2020)ACM International Conference on AI in Finance (ICAIF 2020)
Evaluates Gaussian Copula and GAN-based methods for generating synthetic financial data. Found that Gaussian Copula methods provide a strong baseline, particularly for capturing linear dependencies in tabular financial datasets, while GANs excel at capturing non-linear tail dependencies.
Patki, N., Wedge, R., Veeramachaneni, K. (2016)IEEE International Conference on Data Science and Advanced Analytics (DSAA)
Introduced the SDV framework from MIT's Data to AI Lab, using Gaussian Copulas as the core generative model for multi-table relational datasets. Demonstrated that Gaussian Copula-based synthesis preserves referential integrity and statistical properties across related tables.
Dandi, Y., Avelin, B., Dalalyan, A. (2024)arXiv preprint
Provides theoretical analysis of synthetic data modeled as Gaussian mixtures with noisy labels, using random matrix theory. Demonstrates that iterative feedback during generation significantly improves downstream classifier robustness, offering formal guarantees for Gaussian-based synthetic data pipelines.
Interview & Evaluation Perspective
Common Interview Questions
- ●
How would you generate synthetic tabular data that preserves the correlation structure of the original dataset?
- ●
What is the difference between a single multivariate Gaussian and a Gaussian Mixture Model for data generation?
- ●
How does the Cholesky decomposition enable efficient multivariate Gaussian sampling?
- ●
When would you choose a Gaussian generator over a GAN for synthetic data?
- ●
How would you handle non-Gaussian features (e.g., skewed income data) in a Gaussian generation pipeline?
- ●
What are the privacy risks of releasing mean and covariance parameters estimated from sensitive data?
Key Points to Mention
- ●
The covariance matrix captures all pairwise linear dependencies -- always use multivariate sampling, never independent per-column generation. This is the single most important point.
- ●
Cholesky decomposition transforms independent standard normals into correlated samples: . It is once, then per sample. Know the math, not just the API call.
- ●
GMMs extend single Gaussians to multi-modal data. EM fitting is the standard approach, and BIC/AIC prevents overfitting the number of components.
- ●
Gaussian Copula models separate marginal modeling from dependency modeling -- use when features have non-Gaussian marginals but approximately Gaussian dependencies. This is what production tools like SDV use.
- ●
Post-processing is mandatory: clip impossible values, round integer features, enforce domain constraints. Gaussians have infinite support and will generate out-of-range samples.
- ●
For privacy, aggregate statistics (, ) can leak information from small datasets. Differential privacy mechanisms (Gaussian noise) provide formal guarantees.
Pitfalls to Avoid
- ●
Claiming Gaussian generators can model any distribution -- they are limited to elliptical/linear structures. Always acknowledge this limitation and know when to upgrade to richer models.
- ●
Forgetting that makes the sample covariance singular -- always mention shrinkage estimators (Ledoit-Wolf) when discussing high-dimensional settings.
- ●
Confusing correlation with causation: a Gaussian generator preserves correlations, not causal relationships. Intervening on one variable does not produce correct counterfactuals.
- ●
Using the legacy
np.random.multivariate_normalinstead ofnp.random.default_rng().multivariate_normal-- the modern API has better statistical properties and thread safety.
Senior-Level Expectation
A senior candidate should discuss the full pipeline: parameter estimation (with shrinkage for high dimensions), model selection (BIC for GMM component count), efficient sampling (Cholesky vs. SVD tradeoffs), post-processing constraints, and quality validation (KS tests, correlation comparison, downstream utility). They should also reason about privacy implications -- how aggregate statistics can leak individual information and how differential privacy mitigates this. Senior engineers working in Indian fintech should connect this to the DPDP Act 2023 and RBI data governance guidelines. Finally, they should articulate when a Gaussian generator is insufficient and what the upgrade path looks like: Gaussian Copula for non-Gaussian marginals, GMM for multi-modality, and deep generative models for truly complex distributions.
Summary
The Gaussian Generator is the workhorse parametric data generation method in machine learning -- simple, fast, mathematically principled, and effective for a wide range of tabular data tasks. At its core, it samples synthetic data from one or more Gaussian distributions, parameterized by mean vectors and covariance matrices. The Cholesky decomposition () transforms independent standard normals into correlated samples in per sample, making generation nearly instantaneous even for high-dimensional data.
For multi-modal data, Gaussian Mixture Models extend the single Gaussian to a weighted sum of components, fitted via the EM algorithm. BIC-based model selection prevents overfitting. For tabular data with non-Gaussian marginals, Gaussian Copula models (as implemented in the SDV library) separate marginal modeling from dependency modeling, combining the flexibility of per-column distribution fitting with the principled dependency structure of a Gaussian.
The key limitations are clear: Gaussian generators cannot capture non-linear dependencies, produce values outside domain-valid ranges (requiring post-processing), and suffer from covariance estimation challenges in high dimensions. When these limitations bite, the upgrade path is well-defined: Gaussian Copula for non-Gaussian marginals, CTGAN or VAE for complex non-linear structure, and differential privacy mechanisms for formal privacy guarantees.
For ML system design interviews and production pipelines alike, the Gaussian generator is the right starting point for tabular synthetic data. Master the fundamentals -- covariance estimation, Cholesky sampling, GMM model selection, and quality validation -- and you will know exactly when it is sufficient and when to upgrade to more powerful methods.