Blue-Green Deploy in Machine Learning
Here is the scenario every ML team dreads: you have trained a shiny new model that beats every offline metric, you push it to production, and within minutes your recommendation engine starts serving garbage. Revenue dips, alerts fire, and you are scrambling to roll back. Blue-green deployment exists to make that nightmare recoverable in seconds rather than minutes -- or, ideally, to prevent it from reaching users at all.
Blue-green deployment is a release strategy where two identical production environments -- conventionally called blue (the current live version) and green (the new candidate) -- run simultaneously. Traffic is switched from blue to green in a single, atomic cutover once the green environment passes all validation gates. If anything goes wrong, you flip traffic back to blue instantly.
For ML systems specifically, blue-green deployment solves a problem that traditional software rarely faces: model behavior is non-deterministic and data-dependent. Unit tests and integration tests cannot fully validate a model's real-world performance. You need to run the new model against live traffic patterns, verify prediction distributions, and confirm that business metrics hold -- all before committing to the switch.
From Amazon SageMaker's built-in blue/green guardrails to Kubernetes-native Argo Rollouts, this pattern has become a first-class citizen in the MLOps toolkit. Whether you are deploying a fraud detection model at Razorpay or a recommendation ranker at Flipkart, blue-green deployment gives you the confidence to ship model updates without risking your production SLA.
Concept Snapshot
- What It Is
- A deployment strategy that maintains two identical production environments (blue and green), switching all traffic atomically from the old version to the new once validation passes, enabling zero-downtime releases with instant rollback capability.
- Category
- Deployment
- Complexity
- Intermediate
- Inputs / Outputs
- Input: a validated model artifact (from model registry) and infrastructure configuration. Output: a live production endpoint serving the new model with zero downtime and a preserved rollback target.
- System Placement
- Sits after model training, validation, and registry stages, and directly feeds the model serving / inference endpoint. Works alongside load balancers and monitoring systems.
- Also Known As
- red-black deployment, blue/green release, swap deployment, zero-downtime deployment, immutable deployment
- Typical Users
- ML Engineers, MLOps Engineers, Platform Engineers, SRE / DevOps Engineers, Data Scientists (in smaller teams)
- Prerequisites
- Model Registry, Model Serving / Inference Endpoints, Load Balancing, Container Orchestration (Kubernetes or managed service), Basic CI/CD pipelines
- Key Terms
- blue environmentgreen environmenttraffic cutoverrollbackbaking periodpre-warmingvalidation gatehealth checkproduction variantimmutable infrastructure
Why This Concept Exists
The Problem: Model Updates Are Risky
Updating a production ML model is fundamentally different from updating application code. With code, you can write deterministic tests that cover the important paths. With models, the behavior is a function of the training data, the feature distribution, and the inference-time input distribution -- and none of these are fully capturable in a test suite.
Consider what can go wrong when you naively swap a model in-place:
- Silent quality regression: The new model has lower accuracy on a data slice you did not evaluate offline (e.g., a specific geography, language, or user segment).
- Latency spike: The new model is larger or uses a different architecture, causing P99 latency to breach your SLA.
- Feature incompatibility: The new model expects a feature that the serving pipeline does not yet produce, resulting in null predictions or runtime errors.
- Downstream cascade: A scoring model feeds into a ranking layer that feeds into a business rules engine -- a subtle shift in score distribution can propagate unpredictably.
All of these failure modes are silent or delayed. By the time you notice, the damage is done.
The Historical Context
Blue-green deployment was not invented for ML. The pattern was popularized by Daniel Terhorst-North and Jez Humble at ThoughtWorks around 2005, and documented in the 2010 book Continuous Delivery by Humble and Farley. Martin Fowler's influential blog post brought it to mainstream attention in the DevOps community.
The core insight was simple: if rollback requires redeployment, it is too slow. Instead, keep the old version running and ready to receive traffic at all times. The cost is double the infrastructure; the benefit is instant recovery.
Why ML Needs It Even More Than Traditional Software
Traditional software deployments have converged on rolling updates and canary releases for most use cases. But ML systems have properties that make blue-green deployment particularly valuable:
- Model loading is expensive. A large transformer model can take 30-120 seconds to load onto a GPU. Rolling back by redeploying is unacceptably slow.
- Validation requires live traffic. Offline metrics (AUC, RMSE) do not always correlate with online business metrics (CTR, conversion rate, revenue). You need a period of live validation before committing.
- Atomic cutover matters. Serving two model versions simultaneously (as in canary) can create inconsistent user experiences -- a user might get recommendations from model v2 on one page load and v1 on the next. Blue-green avoids this by switching all traffic at once.
- Regulatory requirements. In financial services (think Razorpay's fraud models or Zerodha's risk scoring), you may need to demonstrate that a model version change was deliberate, validated, and reversible. Blue-green provides a clean audit trail.
Key Insight: Blue-green deployment trades infrastructure cost (running 2x environments) for deployment safety (instant rollback and atomic cutover). For ML systems where model failures are silent and recovery is slow, this tradeoff is almost always worth it.
Core Intuition & Mental Model
The Restaurant Analogy
Imagine you run a restaurant and want to completely redesign the kitchen. You cannot shut down for a week -- customers expect to eat every day. So you build a second kitchen in the back (green), outfit it with the new equipment, and have your chefs practice the new menu there. Meanwhile, the original kitchen (blue) keeps serving customers normally.
When the new kitchen is ready and the chefs are confident, you redirect all orders to the new kitchen in one go. The old kitchen stays intact and staffed for the rest of the evening -- if the new stove breaks down or a dish does not come out right, you can instantly route orders back to the old kitchen. Customers never see the switch. They just get their food.
That is blue-green deployment. The "food" is model predictions. The "customers" are your API consumers. The "switch" is a load balancer or DNS update. And the "old kitchen staying ready" is the rollback capability.
The Key Mental Models
Mental Model 1: The Light Switch. Blue-green is a binary toggle, not a dimmer. Traffic goes 100% to blue or 100% to green. This is fundamentally different from canary deployment (which is the dimmer -- 5%, then 10%, then 25%, etc.). The simplicity of the toggle is both the strength and the limitation.
Mental Model 2: Immutable Environments. Each environment is a self-contained, immutable unit. You never modify the blue environment in place. Instead, you build an entirely new green environment, validate it, and switch. This eliminates an entire class of "works on my machine" deployment bugs because the environment is constructed from scratch every time.
Mental Model 3: The Safety Net. The blue environment is not just the previous version -- it is your active safety net. It remains running, warm, and ready to receive traffic for the entire duration of the baking period. This is what makes rollback instant: there is nothing to deploy, nothing to restart, nothing to warm up. You just flip the switch back.
The Core Promise: At any point during or after deployment, you are exactly one routing change away from your last known-good state. No redeployment, no cold start, no downtime.
Technical Foundations
Formal Model of Blue-Green Deployment
Let us define the system formally. At any time , the deployment system manages two environments:
Each environment hosts a model with version and is characterized by a readiness predicate . A traffic routing function maps all incoming requests to exactly one environment:
The deployment process for a new model version proceeds as:
- Provision: Deploy to while
- Validate: Run validation suite against such that
- Switch: If , atomically update
- Bake: Monitor metrics for a baking period
- Commit or Rollback: If , decommission . Otherwise, (rollback).
Downtime Analysis
The theoretical downtime during a blue-green switch is bounded by the DNS TTL or load balancer propagation time:
With modern load balancers (e.g., AWS ALB, Kubernetes Services), is typically under 1 second, making for practical purposes.
Cost Model
The infrastructure cost during the deployment window is:
For GPU-backed ML models, this cost is significant. If a single serving environment costs per hour, and the baking period is hours, the deployment overhead is:
For example, running a duplicate environment with 4x NVIDIA A10G GPUs on AWS g5.12xlarge instances costs approximately 11.34 (~INR 953) per deployment. Over 50 deployments per month, that is $567 (~INR 47,628) in overhead -- a meaningful but manageable cost for most production ML systems.
Validation Gate Formalization
The validation function typically composes multiple checks:
where each is an individual validation check (health check, latency check, prediction distribution test, business metric threshold). The deployment proceeds only if all checks pass -- a single failure aborts the switch.
Internal Architecture
The architecture of a blue-green deployment system for ML models consists of five major subsystems: the environment manager (provisions and tears down serving environments), the traffic router (controls which environment receives requests), the validation engine (runs automated checks against the green environment), the monitoring stack (observes metrics during the baking period), and the rollback controller (triggers automatic revert on alarm).
Here is how these components interact:
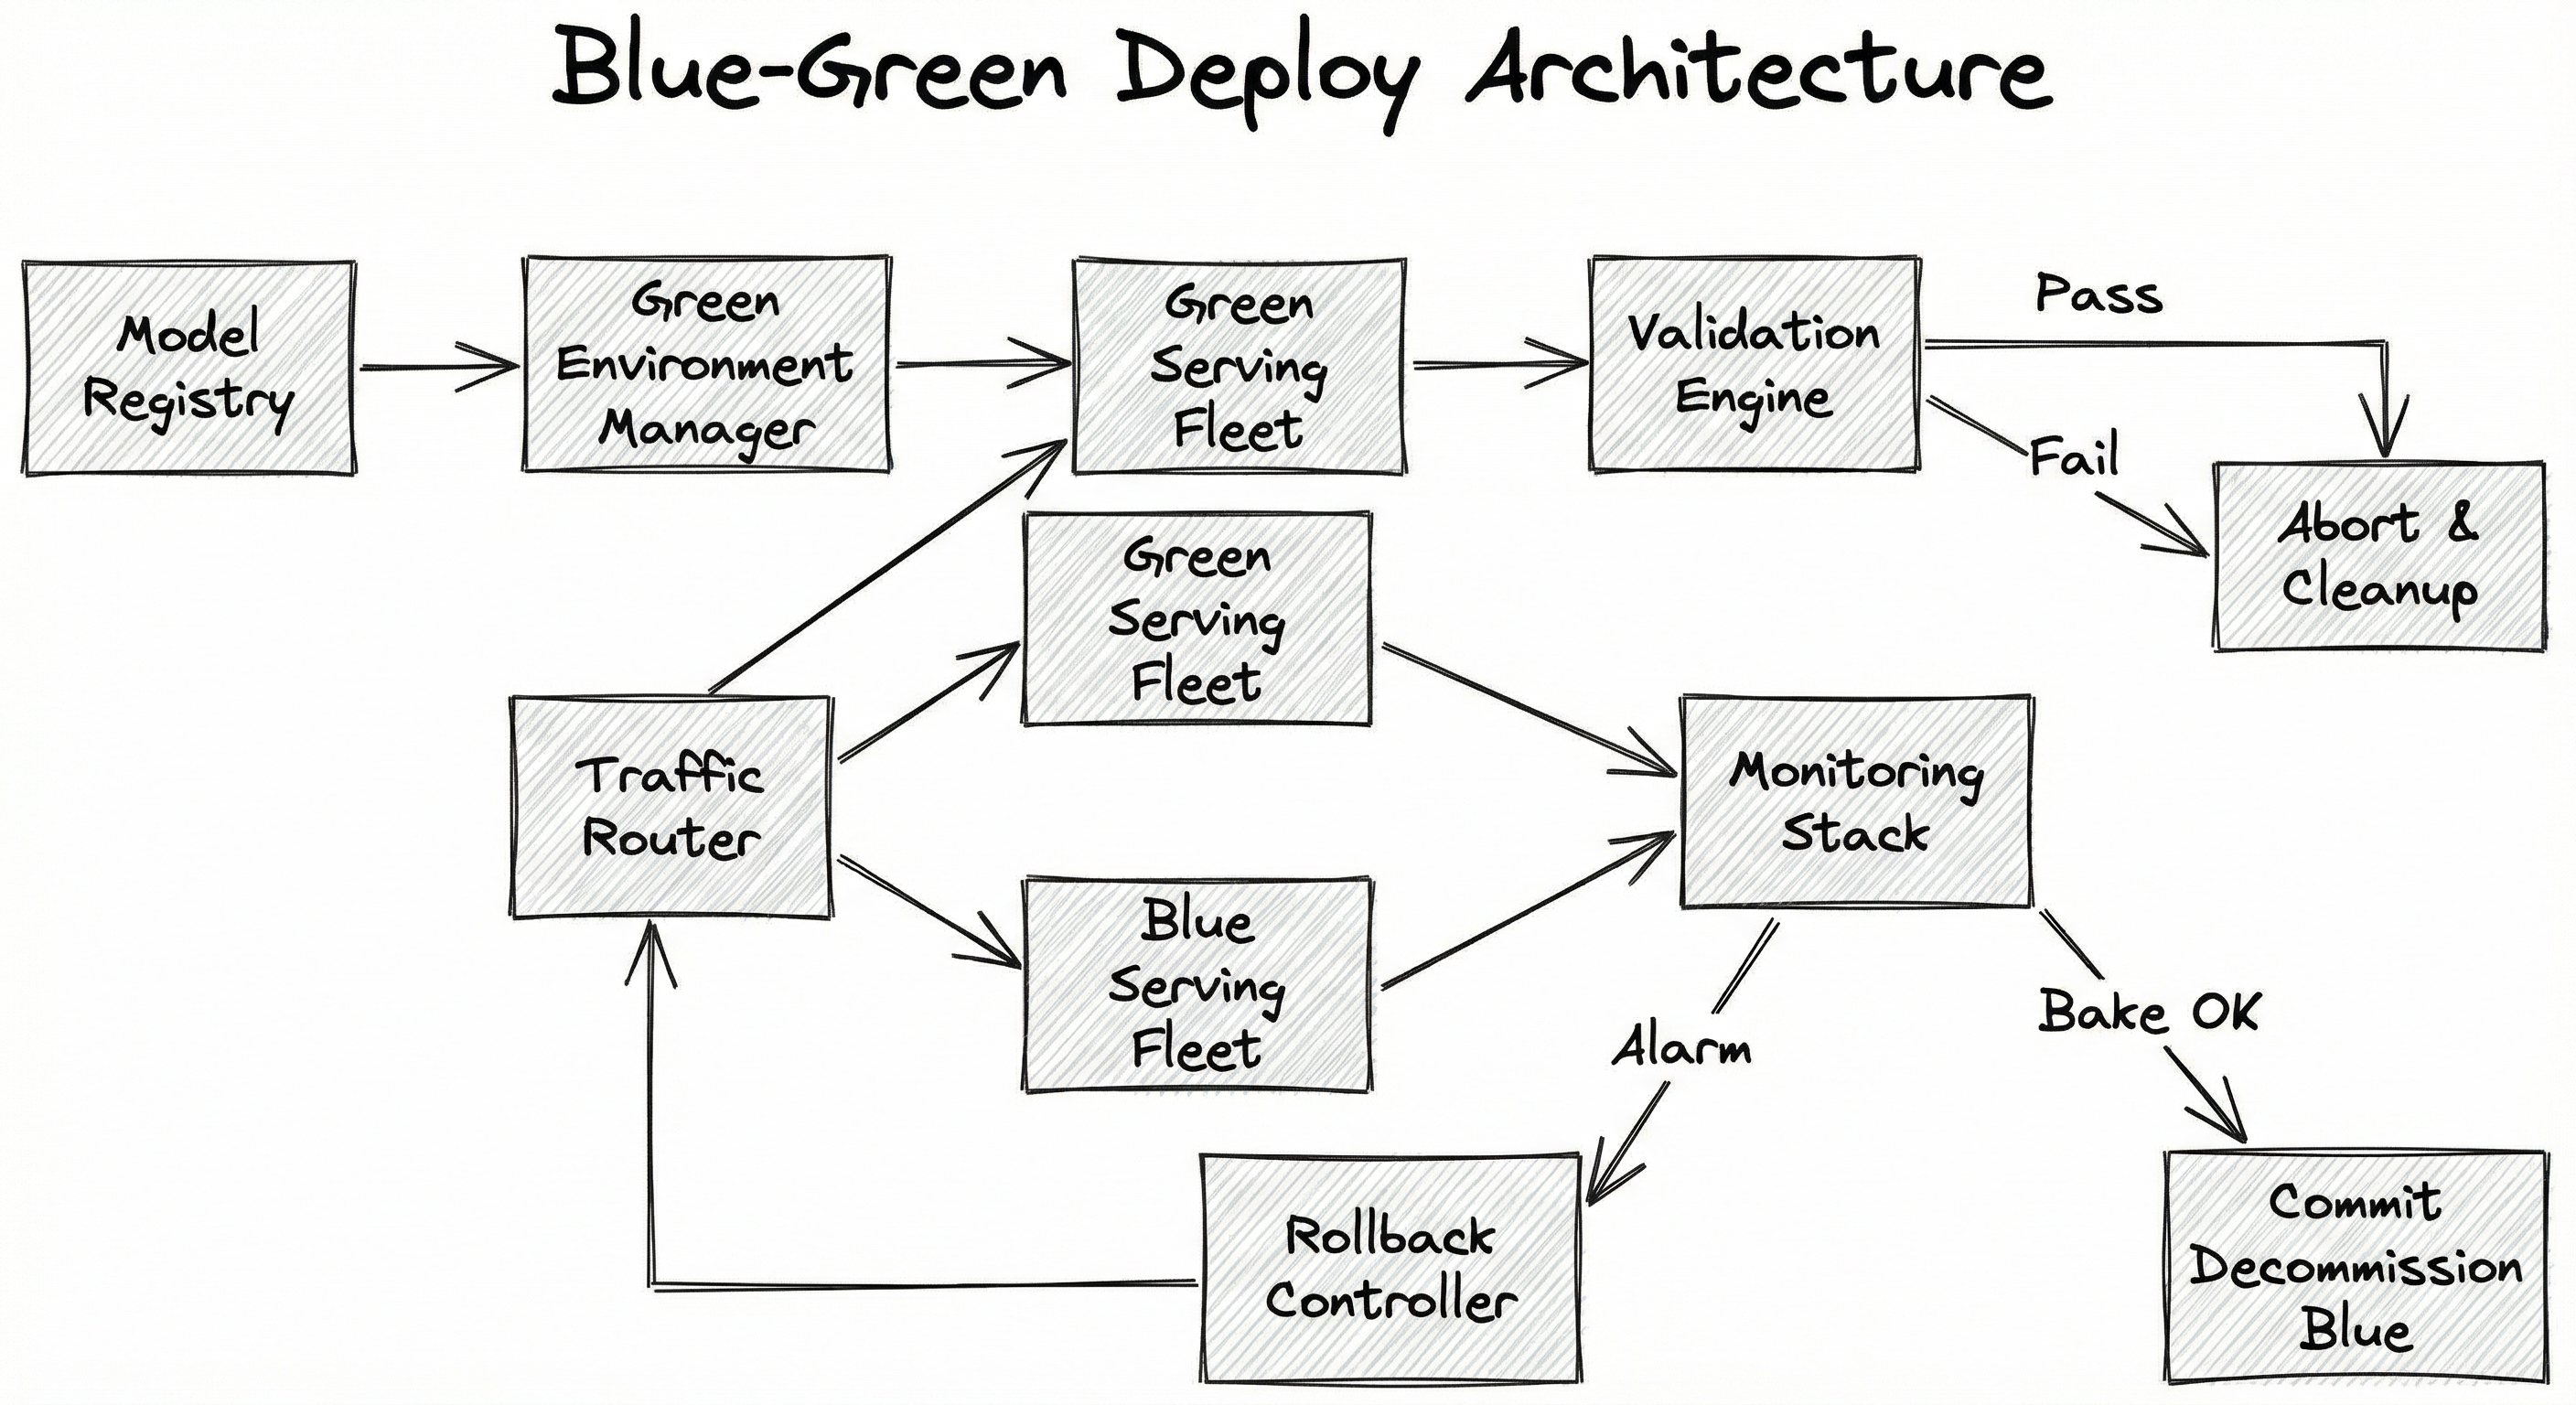
The flow begins when a new model artifact is pushed to the model registry, triggering the green environment manager to provision a new serving fleet. The green fleet loads the model, warms up (runs dummy inference to prime GPU caches and JIT compilation), and then the validation engine runs a battery of tests: health checks, latency benchmarks, prediction distribution comparisons, and optional shadow traffic tests.
If validation passes, the traffic router atomically switches all production traffic from the blue fleet to the green fleet. During the baking period (typically 30 minutes to 4 hours), both fleets remain active while the monitoring stack watches for anomalies. If CloudWatch/Prometheus alarms fire, the rollback controller flips traffic back to blue within seconds. If the bake completes cleanly, the blue fleet is decommissioned and the green fleet becomes the new blue for the next deployment cycle.
Key Components
Model Registry
Stores versioned model artifacts with metadata (training metrics, data lineage, feature schema). Triggers the deployment pipeline when a new model version is promoted to the 'production-candidate' stage. Examples: MLflow Model Registry, SageMaker Model Registry, Vertex AI Model Registry.
Environment Manager
Provisions the green serving environment from infrastructure-as-code templates. Handles container image builds, GPU allocation, auto-scaling group configuration, and model artifact download. Ensures the green environment is an exact replica of the blue environment except for the model version.
Pre-Warming Service
Runs synthetic inference requests against the green fleet before it receives real traffic. This primes GPU memory, triggers JIT compilation (e.g., TorchScript, TensorRT optimization), populates CPU caches, and loads feature lookup tables. Without pre-warming, the first real requests would hit cold-start latency of 10-100x normal.
Validation Engine
Executes a configurable suite of automated checks against the green environment: HTTP health checks, latency percentile validation (P50, P95, P99), prediction distribution comparison (KL divergence or PSI against baseline), schema validation (input/output shapes), and optional smoke tests with golden datasets.
Traffic Router / Load Balancer
Controls the traffic split between blue and green environments. In pure blue-green, this is a binary 0/100 switch. Implemented via Kubernetes Service selectors, AWS ALB target group weights, DNS CNAME swaps, or service mesh (Istio) virtual service routing rules.
Monitoring Stack
Continuously observes both environments during the baking period. Tracks operational metrics (latency, error rate, throughput) and ML-specific metrics (prediction score distributions, feature drift, null prediction rate). Feeds data to the rollback controller for automated decisions.
Rollback Controller
Listens to monitoring alarms and automatically switches traffic back to the blue environment if any threshold is breached. Can be triggered manually by on-call engineers as well. Must complete rollback within seconds -- the whole point of keeping blue alive is to make this fast.
Data Flow
Deployment Flow (Happy Path):
- A new model version is promoted in the Model Registry, triggering the deployment pipeline.
- The Environment Manager provisions a green fleet: spins up containers/VMs, downloads the model artifact, configures auto-scaling.
- The Pre-Warming Service sends synthetic requests to the green fleet until latency stabilizes (typically 50-200 warmup requests for GPU models).
- The Validation Engine runs automated checks against the green fleet. If any check fails, the green fleet is torn down and the pipeline reports failure.
- On validation success, the Traffic Router atomically switches 100% of production traffic from the blue fleet to the green fleet.
- The Monitoring Stack observes both fleets during the baking period (e.g., 1 hour). The blue fleet remains idle but warm.
- If alarms fire during baking, the Rollback Controller flips traffic back to blue in under 5 seconds.
- If the bake completes cleanly, the blue fleet is decommissioned and the green fleet is relabeled as the new blue.
Rollback Flow:
- Monitoring detects an anomaly (e.g., error rate > 1%, P99 latency > 200ms, prediction null rate > 0.1%).
- Rollback Controller updates the Traffic Router to point 100% of traffic to the blue fleet.
- Green fleet is quarantined for post-mortem analysis (logs, prediction samples are preserved).
- Alert is sent to the ML and platform teams.
A top-to-bottom flowchart. The Model Registry feeds into the Green Environment Manager, which provisions the Green Serving Fleet. The Green Fleet connects to the Validation Engine. On pass, the Validation Engine connects to the Traffic Router, which distributes traffic between the Green and Blue Serving Fleets. Both fleets feed into the Monitoring Stack. The Monitoring Stack has two outputs: on alarm, it triggers the Rollback Controller (which feeds back to the Traffic Router); on successful bake, it triggers decommission of the Blue fleet.
How to Implement
Implementation Approaches
Blue-green deployment for ML models can be implemented at several layers of the stack, each with different tradeoffs:
Approach 1: Managed ML Platform (SageMaker, Vertex AI). These platforms provide blue-green deployment as a built-in feature. SageMaker offers BlueGreenUpdatePolicy with configurable traffic shifting modes (all-at-once, canary-then-full, linear). Vertex AI supports traffic splitting across deployed model versions on a single endpoint. The advantage is minimal operational overhead; the disadvantage is vendor lock-in and limited customization.
Approach 2: Kubernetes-native with Argo Rollouts. For teams running their own inference infrastructure on Kubernetes, Argo Rollouts provides a BlueGreen strategy as a CRD. It manages ReplicaSets, service selectors, and promotion/rollback automatically. You get full control over the validation logic via AnalysisRun resources that can query Prometheus, Datadog, or custom metrics endpoints.
Approach 3: Infrastructure-as-Code with DNS/LB switching. The most manual but most flexible approach. You provision two identical environments (e.g., two ECS clusters, two VM groups) using Terraform or Pulumi, and switch traffic at the load balancer or DNS level. This works well for teams with strong infra expertise but limited Kubernetes adoption.
Approach 4: Service Mesh (Istio/Linkerd). If you already run a service mesh, traffic routing between blue and green environments can be controlled via VirtualService resources. This gives you fine-grained control over traffic policies, retries, and circuit breaking during the switch.
Cost Reality Check: Running duplicate GPU infrastructure is expensive. A single
g5.12xlargeinstance (4x A10G GPUs) costs 90.72 (~INR 7,620). Factor this into your deployment budget. In India, teams at startups like Zerodha or Razorpay often optimize by using spot instances for the green fleet during validation, only switching to on-demand once promoted.
import boto3
import json
from datetime import datetime

sm_client = boto3.client("sagemaker")

# Step 1: Create a new model
model_name = f"fraud-model-v2-{datetime.now().strftime('%Y%m%d%H%M')}"
sm_client.create_model(
    ModelName=model_name,
    PrimaryContainer={
        "Image": "763104351884.dkr.ecr.ap-south-1.amazonaws.com/pytorch-inference:2.1.0-gpu-py310-cu121-ubuntu20.04-sagemaker",
        "ModelDataUrl": "s3://ml-models-mumbai/fraud-detection/v2/model.tar.gz",
        "Environment": {
            "SAGEMAKER_PROGRAM": "inference.py",
            "MODEL_VERSION": "2.0.0"
        }
    },
    ExecutionRoleArn="arn:aws:iam::123456789012:role/SageMakerExecutionRole"
)

# Step 2: Create endpoint config with blue/green deployment policy
endpoint_config_name = f"fraud-endpoint-config-{datetime.now().strftime('%Y%m%d%H%M')}"
sm_client.create_endpoint_config(
    EndpointConfigName=endpoint_config_name,
    ProductionVariants=[
        {
            "VariantName": "green-variant",
            "ModelName": model_name,
            "InstanceType": "ml.g5.xlarge",
            "InitialInstanceCount": 2,
            "InitialVariantWeight": 1.0,
        }
    ]
)

# Step 3: Update endpoint with blue/green guardrails
sm_client.update_endpoint(
    EndpointName="fraud-detection-prod",
    EndpointConfigName=endpoint_config_name,
    DeploymentConfig={
        "BlueGreenUpdatePolicy": {
            "TrafficRoutingConfiguration": {
                "Type": "ALL_AT_ONCE",
                "WaitIntervalInSeconds": 300  # 5-minute baking period
            },
            "TerminationWaitInSeconds": 600,  # Keep blue for 10 min after switch
            "MaximumExecutionTimeoutInSeconds": 1800  # 30-min max deployment time
        },
        "AutoRollbackConfiguration": {
            "Alarms": [
                {"AlarmName": "fraud-model-high-error-rate"},
                {"AlarmName": "fraud-model-high-latency"},
                {"AlarmName": "fraud-model-prediction-drift"}
            ]
        }
    }
)

print(f"Blue/green deployment initiated for endpoint 'fraud-detection-prod'")
print(f"Green model: {model_name}")
print(f"Auto-rollback alarms configured: 3 CloudWatch alarms")
This example demonstrates SageMaker's built-in blue/green deployment with auto-rollback. The BlueGreenUpdatePolicy configures an all-at-once traffic shift with a 5-minute baking period. During the bake, SageMaker monitors the specified CloudWatch alarms. If any alarm enters ALARM state (e.g., error rate exceeds threshold), SageMaker automatically rolls back all traffic to the blue fleet. The TerminationWaitInSeconds keeps the blue fleet alive for an additional 10 minutes after the switch, providing a manual rollback window. Note the use of the ap-south-1 (Mumbai) region -- for Indian teams, this minimizes latency to end users.
# rollout.yaml - Argo Rollouts BlueGreen strategy for ML model
apiVersion: argoproj.io/v1alpha1
kind: Rollout
metadata:
  name: recommendation-model
  namespace: ml-serving
spec:
  replicas: 4
  revisionHistoryLimit: 3
  selector:
    matchLabels:
      app: recommendation-model
  template:
    metadata:
      labels:
        app: recommendation-model
    spec:
      containers:
        - name: model-server
          image: registry.example.com/recommendation-model:v2.3.0
          ports:
            - containerPort: 8080
              name: http
            - containerPort: 8081
              name: grpc
          resources:
            requests:
              cpu: "4"
              memory: "16Gi"
              nvidia.com/gpu: "1"
            limits:
              cpu: "8"
              memory: "32Gi"
              nvidia.com/gpu: "1"
          readinessProbe:
            httpGet:
              path: /health
              port: 8080
            initialDelaySeconds: 60
            periodSeconds: 10
          env:
            - name: MODEL_VERSION
              value: "2.3.0"
            - name: WARMUP_REQUESTS
              value: "100"
  strategy:
    blueGreen:
      activeService: recommendation-model-active
      previewService: recommendation-model-preview
      autoPromotionEnabled: false
      prePromotionAnalysis:
        templates:
          - templateName: model-validation
        args:
          - name: service-name
            value: recommendation-model-preview
      postPromotionAnalysis:
        templates:
          - templateName: model-bake-test
        args:
          - name: service-name
            value: recommendation-model-active
      scaleDownDelaySeconds: 1800  # Keep blue alive 30 min post-switch
---
# analysis-template.yaml - Pre-promotion validation
apiVersion: argoproj.io/v1alpha1
kind: AnalysisTemplate
metadata:
  name: model-validation
  namespace: ml-serving
spec:
  args:
    - name: service-name
  metrics:
    - name: latency-p99
      interval: 30s
      count: 10
      successCondition: result[0] < 200
      failureLimit: 2
      provider:
        prometheus:
          address: http://prometheus.monitoring:9090
          query: |
            histogram_quantile(0.99,
              sum(rate(inference_latency_seconds_bucket{
                service="{{args.service-name}}"
              }[2m])) by (le)
            ) * 1000
    - name: error-rate
      interval: 30s
      count: 10
      successCondition: result[0] < 0.01
      failureLimit: 1
      provider:
        prometheus:
          address: http://prometheus.monitoring:9090
          query: |
            sum(rate(inference_errors_total{
              service="{{args.service-name}}"
            }[2m])) /
            sum(rate(inference_requests_total{
              service="{{args.service-name}}"
            }[2m]))
    - name: prediction-distribution
      interval: 60s
      count: 5
      successCondition: result[0] < 0.1
      failureLimit: 1
      provider:
        prometheus:
          address: http://prometheus.monitoring:9090
          query: |
            abs(
              avg(model_prediction_score{service="{{args.service-name}}"})
              - avg(model_prediction_score{service="recommendation-model-active"})
            )
This Argo Rollouts configuration implements blue-green deployment for a GPU-backed recommendation model on Kubernetes. Key elements: (1) autoPromotionEnabled: false requires explicit promotion after validation passes -- no automatic switch. (2) prePromotionAnalysis runs an AnalysisTemplate that checks P99 latency (must be under 200ms), error rate (must be under 1%), and prediction score distribution (must not deviate significantly from the current model). (3) scaleDownDelaySeconds: 1800 keeps the old blue pods running for 30 minutes after promotion, serving as the rollback target. (4) The readiness probe has a 60-second initial delay to allow model loading and warm-up on the GPU.
import requests
import numpy as np
from scipy.stats import ks_2samp
from dataclasses import dataclass
from typing import List, Optional
import logging
import time

logger = logging.getLogger(__name__)


@dataclass
class ValidationResult:
    check_name: str
    passed: bool
    value: float
    threshold: float
    message: str


class BlueGreenDeployer:
    """Orchestrates blue-green deployment for ML model endpoints."""

    def __init__(
        self,
        blue_url: str,
        green_url: str,
        load_balancer_api: str,
        bake_duration_seconds: int = 3600,
        rollback_on_failure: bool = True,
    ):
        self.blue_url = blue_url
        self.green_url = green_url
        self.lb_api = load_balancer_api
        self.bake_duration = bake_duration_seconds
        self.rollback_on_failure = rollback_on_failure

    def health_check(self, url: str, timeout: int = 30) -> ValidationResult:
        """Verify the endpoint is healthy and responding."""
        try:
            resp = requests.get(f"{url}/health", timeout=timeout)
            passed = resp.status_code == 200
            return ValidationResult(
                check_name="health_check",
                passed=passed,
                value=resp.status_code,
                threshold=200,
                message=f"Health check {'passed' if passed else 'FAILED'}: status={resp.status_code}"
            )
        except requests.RequestException as e:
            return ValidationResult(
                check_name="health_check",
                passed=False,
                value=-1,
                threshold=200,
                message=f"Health check FAILED: {str(e)}"
            )

    def latency_check(
        self, url: str, test_payloads: List[dict], p99_threshold_ms: float = 200.0
    ) -> ValidationResult:
        """Measure inference latency against threshold."""
        latencies = []
        for payload in test_payloads:
            start = time.monotonic()
            resp = requests.post(f"{url}/predict", json=payload, timeout=10)
            elapsed_ms = (time.monotonic() - start) * 1000
            if resp.status_code == 200:
                latencies.append(elapsed_ms)

        if not latencies:
            return ValidationResult(
                check_name="latency_check",
                passed=False,
                value=-1,
                threshold=p99_threshold_ms,
                message="Latency check FAILED: no successful predictions"
            )

        p99 = np.percentile(latencies, 99)
        passed = p99 <= p99_threshold_ms
        return ValidationResult(
            check_name="latency_p99",
            passed=passed,
            value=round(p99, 2),
            threshold=p99_threshold_ms,
            message=f"P99 latency: {p99:.2f}ms (threshold: {p99_threshold_ms}ms)"
        )

    def prediction_distribution_check(
        self,
        blue_url: str,
        green_url: str,
        test_payloads: List[dict],
        ks_threshold: float = 0.1,
    ) -> ValidationResult:
        """Compare prediction distributions using Kolmogorov-Smirnov test."""
        blue_scores, green_scores = [], []

        for payload in test_payloads:
            blue_resp = requests.post(f"{blue_url}/predict", json=payload, timeout=10)
            green_resp = requests.post(f"{green_url}/predict", json=payload, timeout=10)

            if blue_resp.status_code == 200 and green_resp.status_code == 200:
                blue_scores.append(blue_resp.json()["score"])
                green_scores.append(green_resp.json()["score"])

        if len(blue_scores) < 30:
            return ValidationResult(
                check_name="prediction_distribution",
                passed=False,
                value=-1,
                threshold=ks_threshold,
                message="Distribution check FAILED: insufficient samples"
            )

        ks_stat, p_value = ks_2samp(blue_scores, green_scores)
        passed = ks_stat <= ks_threshold
        return ValidationResult(
            check_name="prediction_distribution",
            passed=passed,
            value=round(ks_stat, 4),
            threshold=ks_threshold,
            message=f"KS statistic: {ks_stat:.4f} (threshold: {ks_threshold}), p-value: {p_value:.4f}"
        )

    def switch_traffic(self, target: str) -> bool:
        """Atomically switch all traffic to the target environment."""
        resp = requests.post(
            f"{self.lb_api}/route",
            json={"active_backend": target},
            timeout=30
        )
        success = resp.status_code == 200
        logger.info(f"Traffic switched to {target}: {'success' if success else 'FAILED'}")
        return success

    def deploy(
        self,
        test_payloads: List[dict],
        p99_threshold_ms: float = 200.0,
        ks_threshold: float = 0.1,
    ) -> bool:
        """Execute the full blue-green deployment pipeline."""
        logger.info("Starting blue-green deployment...")
        results: List[ValidationResult] = []

        # Gate 1: Health check
        health = self.health_check(self.green_url)
        results.append(health)
        if not health.passed:
            logger.error(f"Deployment aborted: {health.message}")
            return False

        # Gate 2: Latency check
        latency = self.latency_check(self.green_url, test_payloads, p99_threshold_ms)
        results.append(latency)
        if not latency.passed:
            logger.error(f"Deployment aborted: {latency.message}")
            return False

        # Gate 3: Prediction distribution check
        dist = self.prediction_distribution_check(
            self.blue_url, self.green_url, test_payloads, ks_threshold
        )
        results.append(dist)
        if not dist.passed:
            logger.error(f"Deployment aborted: {dist.message}")
            return False

        # All gates passed - switch traffic
        logger.info("All validation gates passed. Switching traffic to green...")
        if not self.switch_traffic("green"):
            logger.error("Traffic switch failed!")
            return False

        # Baking period
        logger.info(f"Baking for {self.bake_duration}s. Blue environment on standby.")
        logger.info("Monitor dashboards: check latency, error rate, prediction drift.")

        for check in results:
            logger.info(f"  {check.check_name}: {'PASS' if check.passed else 'FAIL'} "
                       f"(value={check.value}, threshold={check.threshold})")

        return True


# Usage
if __name__ == "__main__":
    deployer = BlueGreenDeployer(
        blue_url="http://model-blue.internal:8080",
        green_url="http://model-green.internal:8080",
        load_balancer_api="http://lb-controller.internal:9090",
        bake_duration_seconds=3600,
    )

    # Load test payloads from golden dataset
    test_payloads = [
        {"user_id": "u123", "item_id": "i456", "features": [0.1, 0.5, 0.3]},
        {"user_id": "u789", "item_id": "i012", "features": [0.8, 0.2, 0.7]},
        # ... load 500+ payloads from golden dataset
    ]

    success = deployer.deploy(
        test_payloads=test_payloads,
        p99_threshold_ms=150.0,
        ks_threshold=0.05,
    )
    print(f"Deployment {'succeeded' if success else 'failed'}")
This Python orchestrator implements a custom blue-green deployment pipeline with three validation gates: health check, latency P99 check, and prediction distribution comparison using the Kolmogorov-Smirnov test. The KS test is particularly important for ML models -- it detects whether the new model's output distribution has shifted significantly from the current production model. A KS statistic above the threshold (default 0.1) indicates the models behave meaningfully differently, which warrants investigation before switching traffic. This approach is useful when you need more control than managed platforms provide, or when running on-premises infrastructure.
# Terraform configuration for AWS blue-green ML deployment
# blue-green-deploy.tf

resource "aws_lb_target_group" "blue" {
  name     = "ml-model-blue"
  port     = 8080
  protocol = "HTTP"
  vpc_id   = var.vpc_id

  health_check {
    path                = "/health"
    healthy_threshold   = 3
    unhealthy_threshold = 2
    timeout             = 10
    interval            = 15
  }
}

resource "aws_lb_target_group" "green" {
  name     = "ml-model-green"
  port     = 8080
  protocol = "HTTP"
  vpc_id   = var.vpc_id

  health_check {
    path                = "/health"
    healthy_threshold   = 3
    unhealthy_threshold = 2
    timeout             = 10
    interval            = 15
  }
}

resource "aws_lb_listener_rule" "model_routing" {
  listener_arn = aws_lb_listener.main.arn
  priority     = 100

  action {
    type = "forward"
    forward {
      target_group {
        arn    = aws_lb_target_group.blue.arn
        weight = var.blue_weight  # 100 during normal, 0 after switch
      }
      target_group {
        arn    = aws_lb_target_group.green.arn
        weight = var.green_weight  # 0 during normal, 100 after switch
      }
    }
  }

  condition {
    path_pattern {
      values = ["/v1/predict*"]
    }
  }
}

# CloudWatch alarm for auto-rollback
resource "aws_cloudwatch_metric_alarm" "model_error_rate" {
  alarm_name          = "ml-model-high-error-rate"
  comparison_operator = "GreaterThanThreshold"
  evaluation_periods  = 2
  metric_name         = "5XXError"
  namespace           = "AWS/ApplicationELB"
  period              = 60
  statistic           = "Average"
  threshold           = 0.01
  alarm_description   = "Triggers rollback if 5XX rate exceeds 1%"
}
Common Implementation Mistakes
- ●
Skipping pre-warming: Deploying to the green environment and immediately switching traffic without warming up the model. GPU-backed models need 50-200 warmup requests to prime CUDA kernels, JIT-compile operators, and populate caches. The first real requests will see 10-100x higher latency, potentially triggering your own auto-rollback alarms. Always run a warmup phase before validation.
- ●
Baking period too short: Setting a 5-minute baking period when your model's impact on business metrics takes 30-60 minutes to manifest. A recommendation model might look fine for 5 minutes but cause a gradual CTR drop that only becomes statistically significant after an hour. Match the bake duration to your metric observation window.
- ●
Not monitoring ML-specific metrics: Only watching HTTP error rates and latency during the bake, ignoring prediction distribution shifts, feature null rates, and business KPIs. A model can return 200 OK with terrible predictions -- operational metrics will not catch this. Always include prediction-level metrics in your monitoring.
- ●
Decommissioning blue too early: Tearing down the blue environment immediately after the green switch to save costs. If a subtle issue surfaces 2 hours later, you have no instant rollback target. Keep blue alive for at least 2x your baking period, or until you have high confidence in the green environment.
- ●
Ignoring database/state compatibility: The new model version may expect different feature schemas, cache formats, or downstream API contracts. If the green model writes to shared state (e.g., a feature store or prediction log) in an incompatible format, rolling back to blue will encounter corrupted state. Always ensure backward-compatible state management.
- ●
Same infrastructure for both environments in cost-critical setups: Running identical GPU fleets for blue and green doubles your GPU spend. In cost-sensitive deployments (common at Indian startups), consider using smaller green fleets for validation, then scaling up before switching. Or use spot/preemptible instances for the green fleet during the validation phase.
When Should You Use This?
Use When
You need zero-downtime model updates with guaranteed instant rollback -- especially for revenue-critical serving endpoints (e.g., Flipkart search ranking, Swiggy ETA prediction)
Your model loading time is long (>30 seconds) and rolling restart would cause unacceptable cold-start latency spikes during the deployment window
Regulatory or compliance requirements mandate that model version changes are auditable, deliberate, and reversible (financial services, healthcare ML)
You want atomic cutover -- all users see the same model version at any given time, avoiding inconsistent experiences from running two versions simultaneously
Your validation process requires running the new model against live traffic patterns before committing, and you need the old model as a fallback during this validation window
The blast radius of a bad model deployment is large (e.g., all traffic is affected, not just a segment) and you want to minimize exposure time
Your team prefers operational simplicity -- blue-green is conceptually simpler than canary (binary switch vs. gradual rollout with traffic percentages)
Avoid When
Infrastructure cost is the primary constraint and you cannot afford running 2x your serving fleet, even temporarily. This is especially relevant for GPU-heavy workloads where doubling the fleet can cost thousands of dollars per hour
You need gradual exposure to validate the model on a small percentage of traffic before full rollout -- canary deployment is better suited for this
Your model updates are frequent (multiple times per day) and the overhead of provisioning a full parallel environment for each deployment is prohibitive
You want to run true A/B tests with statistical significance between model versions -- blue-green switches all traffic, which prevents controlled experimentation
Your serving infrastructure is stateful in ways that make running two environments complex (e.g., models that maintain per-user state or session affinity that cannot be easily replicated)
The model is non-critical (e.g., a content tag suggestion model) where occasional degradation is acceptable and a simple rolling update suffices
Key Tradeoffs
The Central Tradeoff: Safety vs. Cost
Blue-green deployment is fundamentally a safety-over-cost choice. You are paying for redundant infrastructure to buy deployment confidence. The key question is: how much is a bad deployment worth avoiding?
For a fraud detection model at Razorpay processing thousands of transactions per second, 5 minutes of bad predictions could mean lakhs of rupees in fraudulent transactions approved. The cost of running a duplicate environment for 2 hours (~INR 8,000 for a modest GPU setup) is trivial compared to the blast radius.
For a blog post recommendation model at a small content startup, the calculus is different. Bad recommendations for 5 minutes while you roll back a canary deployment might cost you some engagement, but probably not enough to justify 2x infrastructure cost.
Comparison Matrix
| Factor | Blue-Green | Canary | Rolling Update | Shadow |
|---|---|---|---|---|
| Downtime | Zero | Zero | Near-zero | N/A (read-only) |
| Rollback speed | Instant (~1s) | Fast (~30s) | Slow (~minutes) | N/A |
| Infrastructure cost | 2x during deploy | 1.1-1.5x | 1x | 2x |
| User exposure to new version | All at once | Gradual (1-100%) | Gradual (pod by pod) | None |
| A/B testing capability | No | Limited | No | No |
| Implementation complexity | Medium | High | Low | High |
| Best for ML models | Yes | Yes | Risky | Yes (pre-validation) |
The GPU Cost Problem
For CPU-only models, doubling the fleet might cost $50-200/month (~INR 4,200-16,800/month) extra. Manageable. But for GPU models, the math changes dramatically:
- A single
ml.g5.xlarge(1x A10G) on SageMaker: ~$1.41/hour (~INR 118/hour) - A fleet of 8 GPU instances running for a 2-hour bake: ~$22.56 (~INR 1,895) per deployment
- At 30 deployments/month: ~$676 (~INR 56,784) monthly deployment overhead
This is why many teams use a hybrid approach: shadow testing + blue-green. The shadow test (running the new model in parallel without serving its predictions) happens first at minimal cost. Only if shadow metrics look good do you spin up the full green environment for the blue-green switch. This reduces the number of full blue-green deployments and thus the cost.
Rule of Thumb: Use blue-green deployment for your highest-stakes models (revenue, safety, compliance). Use canary or rolling updates for lower-risk models. Use shadow testing as a pre-filter to reduce unnecessary blue-green deployments.
Alternatives & Comparisons
Canary deployment gradually shifts traffic from the old model to the new one (e.g., 5% -> 25% -> 50% -> 100%) over time. Choose canary when you want to validate on a small subset of real traffic before full rollout, when you want to minimize blast radius, or when you cannot afford 2x infrastructure. Choose blue-green when you need atomic cutover (all users on the same version), instant rollback, or when your validation gates are binary (pass/fail) rather than requiring gradual observation. Many mature teams use both: canary for routine updates, blue-green for major model version changes.
Rolling updates replace pods/instances one at a time, so there is always a mix of old and new versions serving traffic during the update window. This is the Kubernetes default and has zero additional infrastructure cost. Choose rolling updates for non-critical models where mixed-version serving during the rollout is acceptable. Choose blue-green when you cannot tolerate mixed versions, when rollback needs to be instant (rolling back a rolling update requires another full rollout), or when model loading time makes per-pod restarts too slow.
Shadow deployment runs the new model alongside production but does not serve its predictions to users -- it only logs them for offline comparison. This is the safest pre-validation strategy because there is zero user impact. Choose shadow deployment as a precursor to blue-green: validate in shadow first, then do the blue-green switch. The downside is that shadow deployment cannot validate real user-facing behavior (e.g., how users react to different recommendations), and it still requires duplicate infrastructure.
Load balancer-level traffic splitting is a more general pattern that underpins both blue-green and canary deployments. It provides the routing mechanism but not the orchestration (validation gates, auto-rollback, baking periods). Choose a full blue-green deployment system when you need the end-to-end orchestration, not just the routing switch.
Pros, Cons & Tradeoffs
Advantages
Instant rollback -- because the blue environment remains running and warm, reverting to the previous model version takes seconds (a single routing change), not minutes. This is the single most important benefit for ML systems where model failures are often silent.
Zero downtime -- traffic is switched atomically at the load balancer level. Users never see an error page, a 503, or degraded predictions during the transition. The switch is invisible to end users.
Atomic cutover -- all users see the same model version at any given time. This eliminates the consistency problems of canary or rolling deployments where different users might get predictions from different model versions simultaneously.
Clean validation boundary -- you can run comprehensive validation (latency, prediction distribution, business metrics) against the green environment using real-scale infrastructure before switching any production traffic. The validation happens on an environment identical to production, not a scaled-down test bed.
Simplified debugging -- when an issue occurs, you know exactly which model version caused it because there was a single, discrete switch point. No ambiguity about which version of the model was serving a particular request.
Regulatory compliance -- the deployment provides a clear audit trail: model version A was live from time T1, model version B was live from time T2, and the switch was triggered by a specific validation pipeline. Essential for financial services and healthcare ML.
Disadvantages
Double infrastructure cost during deployment -- you must run two complete serving environments simultaneously. For GPU-heavy ML workloads, this can cost $500-5,000+ (~INR 42,000-4,20,000) per deployment depending on fleet size and baking period duration.
No gradual exposure -- unlike canary deployment, blue-green is all-or-nothing. You cannot expose 5% of users to the new model and watch metrics for a day. If a subtle issue only affects a small user segment, you might not detect it during the baking period with aggregated metrics.
Database and state migration complexity -- if the new model version requires schema changes in feature stores, prediction logs, or downstream databases, you need backward-compatible migrations. The blue environment must still be able to function after rollback, even if the green environment has written new-format data.
Long-lived sessions may break -- if users have active sessions or in-flight requests during the switch, they may experience inconsistencies. This is particularly relevant for streaming ML models or real-time feature pipelines that maintain state.
Infrastructure provisioning latency -- spinning up a full green environment (especially with GPUs) can take 5-15 minutes. This adds to the total deployment time and means you cannot do rapid iteration cycles during development.
Over-engineering for low-stakes models -- for models where a brief degradation is acceptable (e.g., a tag suggestion model, a content summarizer), the infrastructure overhead of blue-green deployment is not justified. A simple rolling update would suffice.
Failure Modes & Debugging
Green environment passes validation but fails under production load
Cause
Validation was run with synthetic or low-volume traffic that did not exercise the full range of production input patterns. For example, the validation dataset did not include edge-case inputs (very long text, unusual feature values, specific geographic patterns) that appear in real traffic. Additionally, the green fleet may have been validated at a lower concurrency than production QPS.
Symptoms
Latency spikes or errors appear within minutes of the traffic switch, but only for specific request types. Aggregated metrics may initially look fine while P99 latency degrades. Downstream services that consume model predictions start logging errors.
Mitigation
Use representative production traffic replays (captured via traffic mirroring) for validation, not synthetic datasets. Run load tests at 1.2x peak QPS before switching. Include long-tail input patterns in your golden validation set. Monitor at the percentile level (P95, P99), not just averages.
Rollback fails due to blue environment degradation
Cause
The blue environment was not properly maintained during the baking period. Common causes: auto-scaling reduced blue fleet size to zero because it received no traffic, health checks failed on idle blue pods and Kubernetes evicted them, or the underlying spot instances were reclaimed.
Symptoms
When rollback is triggered, traffic routes to the blue environment but receives 503 errors or extreme latency because blue pods are no longer ready. Effectively, rollback causes a partial outage -- the exact scenario blue-green was supposed to prevent.
Mitigation
Configure minimum replica count for the blue environment that cannot be scaled down during the baking period. Use on-demand instances (not spot) for the blue fleet. Add a periodic health check that pings the blue environment every 30 seconds during the bake to ensure it remains responsive. Set scaleDownDelaySeconds generously in Argo Rollouts.
DNS propagation delay causes split-brain traffic
Cause
When using DNS-based switching (e.g., Route53 weighted routing or CNAME swaps), DNS caches at various levels (client, ISP, CDN) may serve stale records for the duration of the TTL. This means some users hit the blue environment while others hit green, violating the atomic cutover guarantee.
Symptoms
After the switch, monitoring shows traffic on both blue and green environments. Some users report different behavior than others. Metrics show a gradual rather than instant transition. The duration of the split depends on your DNS TTL (commonly 60-300 seconds).
Mitigation
Use load balancer-level switching (ALB target group weights, Kubernetes Service selectors, Istio VirtualService routing) instead of DNS switching. These propagate in seconds, not minutes. If DNS switching is unavoidable, set TTL to the minimum (e.g., 10 seconds) well before the deployment.
Pre-warming insufficient causes cold-start latency spike
Cause
The green environment was not adequately warmed before receiving production traffic. GPU models require JIT compilation of CUDA kernels, TensorRT optimization plan generation, and CPU cache priming. Without sufficient warmup, the first batch of real requests sees 10-100x higher latency.
Symptoms
Immediately after the traffic switch, P99 latency spikes dramatically (e.g., from 50ms to 5000ms), potentially triggering the auto-rollback alarm. After 30-60 seconds, latency normalizes as the model warms up -- but by then, the rollback may have already been triggered, creating a frustrating loop.
Mitigation
Run at least 100-500 warmup requests through the green environment using representative payloads before switching traffic. For transformer models on GPU, also trigger a forward pass with the maximum batch size to compile all CUDA kernels. Implement a readiness probe that only reports healthy after warmup completes. Set your auto-rollback alarm to have a 2-3 minute evaluation period to avoid false triggers from transient warmup latency.
State incompatibility between model versions
Cause
The new model version writes data to shared stores (feature store, prediction cache, A/B test logging) in a format that is incompatible with the old model version. When rollback to blue occurs, the blue model encounters corrupted or unreadable state.
Symptoms
After rollback, the blue model starts producing errors or degraded predictions because it reads state written by the green model in an unexpected format. This can manifest as null predictions, schema validation errors in downstream consumers, or silently wrong feature lookups.
Mitigation
Enforce backward-compatible state changes as a deployment rule. Use versioned schemas for all shared state. Implement the expand-contract pattern: first deploy a version that can read both old and new formats, then migrate the data, then deploy a version that writes only the new format. Never let the green model write incompatible state to stores that blue depends on.
Cost runaway from forgotten blue environments
Cause
The deployment automation provisions a green environment and switches traffic, but the decommissioning step for the (now old) blue environment fails silently or is never triggered. Over multiple deployments, orphaned environments accumulate, consuming GPU resources without serving traffic.
Symptoms
Cloud billing shows unexplained GPU cost increases month over month. Resource utilization dashboards show idle GPU instances. In extreme cases (common in fast-moving Indian startups with rapid iteration cycles), teams discover they are paying for 5-10 orphaned environments from previous deployments.
Mitigation
Implement a TTL-based cleanup policy: any environment that has not served traffic for more than N hours is automatically terminated. Tag all deployment resources with a deployment-id and created-at timestamp. Run a daily cleanup job that identifies and deletes orphaned resources. Set up cost alerts that trigger when GPU spend exceeds the expected baseline by >20%.
Placement in an ML System
Where Does Blue-Green Deployment Sit?
Blue-green deployment is the final gate between a validated model artifact and live production traffic. It sits at the very end of the ML pipeline, after all offline work (data collection, feature engineering, training, evaluation) and after the model has been registered in the model registry with passing offline metrics.
In a typical production ML system, the flow is:
- Training pipeline produces a model artifact and logs metrics.
- Model registry stores the artifact, along with metadata (training data version, hyperparameters, evaluation results).
- Validation pipeline runs offline tests (accuracy on holdout set, fairness checks, latency benchmarks on test hardware).
- Blue-green deployment provisions the green environment, loads the model, runs live validation, and switches traffic.
- Model serving (the endpoint itself) serves predictions to downstream consumers.
Blue-green deployment is tightly coupled with the load balancer (which implements the traffic switch) and the monitoring stack (which drives the bake-or-rollback decision). It also interacts with the model registry to fetch the correct artifact version and report deployment status.
At companies like Flipkart or Swiggy, blue-green deployment is often embedded in a broader MLOps platform (similar to Uber's Michelangelo) that orchestrates the entire lifecycle from training to serving, with deployment as one automated stage in the pipeline.
Pipeline Stage
Deployment / Serving
Upstream
- model-registry
- model-serving
- load-balancer
Downstream
- model-serving
- load-balancer
Scaling Bottlenecks
The primary scaling bottleneck is infrastructure duplication cost. As your model serving fleet grows (more GPUs, more replicas for higher QPS), the cost of maintaining a parallel environment scales linearly. A team running 32 GPUs for a large language model serving fleet would need 64 GPUs during the deployment window.
Concrete numbers for AWS Mumbai region (ap-south-1):
- 4x
ml.g5.xlarge(1x A10G each): ~$5.64/hour (~INR 474/hour) for the duplicate fleet - 8x
ml.g5.2xlarge(1x A10G each): ~$15.12/hour (~INR 1,270/hour) for the duplicate fleet - 4x
ml.p4d.24xlarge(8x A100 each): ~$131.28/hour (~INR 11,028/hour) for the duplicate fleet
The second bottleneck is environment provisioning time. Spinning up GPU instances, pulling large container images (10-50GB for ML models), loading model weights into GPU memory, and running warmup can take 10-20 minutes. This limits how quickly you can initiate a deployment.
The third bottleneck is monitoring infrastructure. During the baking period, you need to ingest, process, and alert on metrics from both environments simultaneously. If your Prometheus or Datadog setup is already at capacity, the doubled metric volume can cause scrape delays or alert lag.
Production Case Studies
Netflix pioneered the red/black deployment pattern (their name for blue-green) using Spinnaker, their open-source continuous delivery platform. For ML models powering recommendation and personalization, Netflix uses red/black deployments to swap entire server groups atomically. Their approach includes automated canary analysis (using Kayenta) before the red/black switch, ensuring that the new model version meets statistical significance thresholds on key engagement metrics before full traffic cutover.
Netflix achieves zero-downtime deployments across 200M+ subscribers globally. Their red/black + canary hybrid approach has been documented as reducing deployment-related incidents by enabling instant rollback when canary analysis detects regression.
Uber's Michelangelo platform implements graduated rollouts with automatic rollback for ML model deployments. Their system includes explicit data and feature validation gates, mandatory backtesting and shadow testing before production deployment, and controlled rollouts with automatic rollback based on real-time monitoring. They use a blue/green embedding-column pattern for biweekly model and index refreshes, with automated validation gates checking completeness, backward compatibility, and correctness.
Uber's deployment safety framework supports over 15 million real-time predictions per second at peak. By default, every deployment benefits from automated data-quality checks, system-level monitoring with alerting, and a gradual rollout with rollback protection. This has significantly reduced ML-related production incidents.
AWS SageMaker provides native blue/green deployment as a first-class feature for ML model endpoints. When you update a SageMaker endpoint, it automatically provisions a new fleet (green), shifts traffic using configurable modes (all-at-once, canary, or linear), monitors CloudWatch alarms during the baking period, and auto-rolls back if alarms trigger. SageMaker's blue/green deployment has been adopted by hundreds of enterprises running production ML workloads on AWS, including several Indian enterprises deploying in the ap-south-1 (Mumbai) region.
SageMaker's built-in blue/green deployment reduced the average endpoint update time while maintaining zero-downtime guarantees. The auto-rollback feature based on CloudWatch alarms has prevented numerous production incidents for teams that previously relied on manual rollback procedures.
Flipkart's engineering team has built infrastructure to handle over 1 million queries per second with zero-downtime maintenance, particularly critical during Big Billion Days sale events. Their ML models for search ranking, product recommendations, and fraud detection are deployed using blue-green patterns that allow model updates without any service interruption. The deployment pipeline ensures that new model versions are fully validated against representative traffic patterns before the switch, with instant rollback capability to the previous version.
Flipkart achieved zero-downtime deployments that once took days now complete in minutes, with rolling upgrades across over 200 clusters maintaining consistent sub-millisecond reads even during peak traffic events exceeding 1M QPS.
Razorpay processes millions of payment transactions daily and uses ML models for fraud detection and risk scoring. Given the regulatory and financial stakes, their ML deployment strategy prioritizes safety and auditability. Their platform team uses blue-green deployment patterns to update fraud models, ensuring that the previous model version remains available for instant rollback. Model validation gates check prediction distributions against a golden dataset of known fraud/legitimate transactions before the switch.
The blue-green deployment approach allows Razorpay to update fraud detection models multiple times per week without any downtime to the payment processing pipeline, maintaining their SLA of sub-100ms fraud scoring latency for every transaction.
Tooling & Ecosystem
Built-in blue/green deployment for SageMaker endpoints. Supports all-at-once, canary, and linear traffic shifting modes. Integrates with CloudWatch alarms for auto-rollback. Available in the Mumbai (ap-south-1) region for Indian deployments. Starting cost: ~$0.28/hour (~INR 23/hour) for a single ml.m5.large instance.
Kubernetes controller providing advanced deployment capabilities including blue-green and canary strategies. Supports AnalysisRun resources that integrate with Prometheus, Datadog, New Relic, and custom metrics providers for automated validation and promotion decisions. The de facto standard for Kubernetes-native progressive delivery.
Netflix's open-source continuous delivery platform with first-class support for red/black (blue-green) deployments across multiple cloud providers (AWS, GCP, Azure, Kubernetes). Includes Kayenta for automated canary analysis. Heavyweight but battle-tested at Netflix scale.
Kubernetes-native ML model serving platform that supports blue-green, canary, and A/B testing deployment patterns out of the box. Integrates with Istio for traffic management and Prometheus/Grafana for monitoring. Specifically designed for ML workloads with built-in support for model explanations and drift detection.
Vertex AI endpoints support traffic splitting across multiple deployed model versions, enabling blue-green and canary patterns. You can deploy a new model with 0% traffic, validate, then switch to 100%. Available in the Mumbai region (asia-south1) for Indian deployments.
Service mesh that provides fine-grained traffic routing via VirtualService and DestinationRule resources. Enables blue-green deployment at the service mesh layer with features like circuit breaking, retries, and mutual TLS between blue and green environments.
Progressive delivery tool for Kubernetes that works with Istio, Linkerd, App Mesh, and Nginx. Automates blue-green and canary deployments with customizable analysis using Prometheus metrics, webhooks, and acceptance tests. Lighter-weight alternative to Argo Rollouts.
AWS sample project demonstrating safe blue/green deployment of SageMaker endpoints using CodePipeline, CodeBuild, and CodeDeploy. Provides a reference architecture for automated ML model deployment with validation gates and rollback.
Research & References
Sculley, Holt, Golovin, Davydov, Phillips, Ebner, Chaudhary, Young, Crespo, Dennison (2015)NeurIPS 2015
Seminal Google paper identifying deployment and configuration management as major sources of technical debt in ML systems. Highlights how ML systems create hidden dependencies that make safe deployment critical -- a foundational motivation for blue-green deployment patterns.
Renggli, Karlas, Ber, Liu, Zhang (2022)arXiv preprint
Discusses CI/CD pipeline architectures for ML model deployment, including blue-green and canary strategies within the MLOps framework. Addresses the unique challenges of deploying ML components compared to traditional software.
Kreuzberger, Kuhl, Hirschl (2023)IEEE Access
Comprehensive survey defining MLOps principles and architecture. Covers deployment strategies (blue-green, canary, shadow) as core MLOps practices and proposes a reference architecture for ML system deployment automation.
Kumar, Singh, et al. (2024)arXiv preprint
Examines the challenges of integrating ML components into CI/CD pipelines. Emphasizes containerization, environment versioning, and continuous monitoring post-deployment -- key enablers for reliable blue-green ML deployments.
Sato, Wider, Windheuser (2019)Martin Fowler's Blog (ThoughtWorks)
Influential practitioner article defining the CD4ML framework. Describes how deployment strategies including blue-green and canary apply specifically to ML systems, with worked examples of model validation gates and rollback procedures.
Suo, Bhasi, Wang, Gao, Chen, He (2024)ACM SoCC 2024
Addresses the cold-start problem in ML inference -- directly relevant to blue-green deployment where the green environment must be warmed before receiving production traffic. Proposes opportunistic pre-loading techniques that reduce cold-start latency by up to 85%.
Interview & Evaluation Perspective
Common Interview Questions
- ●
How would you design a zero-downtime deployment system for an ML model serving 100K QPS?
- ●
What is the difference between blue-green and canary deployment for ML models? When would you choose one over the other?
- ●
How do you handle rollback when a newly deployed model performs poorly in production?
- ●
What validation checks would you run before switching traffic to a new model version?
- ●
How do you manage the 2x infrastructure cost of blue-green deployment for GPU-heavy workloads?
- ●
Describe the deployment strategy you would use for a fraud detection model at a payment company like Razorpay.
- ●
What happens if the green environment passes all validation gates but fails under real production load?
Key Points to Mention
- ●
Blue-green provides instant rollback (seconds, not minutes) because the old environment stays warm and ready. For ML models with long load times (30-120s), this is a massive advantage over rolling restarts.
- ●
The pattern trades infrastructure cost for deployment safety. Quantify this: for a fleet of N GPU instances, blue-green costs 2N during the baking period. A 2-hour bake with 8x A10G GPUs costs ~$91 (~INR 7,600) per deployment.
- ●
Pre-warming is critical for GPU models. Without it, the first production requests hit cold-start latency (10-100x normal), potentially triggering your own auto-rollback alarms. Always warm with representative payloads.
- ●
Validation gates should include both operational metrics (latency P99, error rate, throughput) and ML-specific metrics (prediction distribution comparison, feature null rates, score calibration).
- ●
DNS-based switching has propagation delays (60-300s depending on TTL). Prefer load balancer or service mesh routing for truly atomic cutover.
- ●
Distinguish blue-green from canary: blue-green is a binary switch (all traffic at once), canary is a gradual rollout (5% -> 25% -> 100%). Blue-green is simpler but provides no gradual exposure.
- ●
Mention the hybrid approach: use shadow testing first (zero user impact), then blue-green for the actual switch. This reduces the number of full blue-green deployments and thus cost.
Pitfalls to Avoid
- ●
Claiming blue-green and canary deployment are the same thing -- they are fundamentally different patterns. Blue-green is all-or-nothing; canary is gradual.
- ●
Forgetting to discuss the cost implications for GPU workloads. An interviewer at a cost-conscious startup will want to hear how you manage the 2x infrastructure overhead.
- ●
Ignoring ML-specific validation. Saying "we check health and latency" is insufficient. Discuss prediction distribution comparison, feature drift detection, and business metric monitoring during the bake.
- ●
Not addressing the cold-start problem. If you propose blue-green for a large transformer model without mentioning pre-warming, the interviewer will question your production experience.
- ●
Treating deployment as purely an infrastructure problem. Senior candidates should discuss how deployment strategy connects to model governance, experiment tracking, and business impact measurement.
Senior-Level Expectation
A senior or staff-level candidate should be able to design the end-to-end deployment system, not just the blue-green switch. This means: (1) how the model artifact flows from the registry to the green environment, (2) what specific validation gates you would implement and why (with concrete thresholds -- e.g., KS statistic < 0.05, P99 < 200ms, error rate < 0.1%), (3) how you handle state compatibility between model versions, (4) the cost model for your deployment (how much it costs per deployment, how to optimize it), (5) how the deployment strategy integrates with the broader MLOps pipeline (experiment tracking, monitoring, alerting), and (6) when you would choose blue-green vs. canary vs. shadow deployment for different risk profiles. At Indian tech companies specifically, expect questions about optimizing deployment costs -- spot instances for green fleet, right-sizing GPU types, reducing baking periods with better offline validation. The ability to reason about deployment as a system design problem (not just an ops procedure) is what separates senior from mid-level engineers.
Summary
Key Takeaways
Blue-green deployment is a safety-first deployment strategy for ML models that maintains two identical production environments -- blue (current) and green (new) -- and switches all traffic atomically once the green environment passes validation. The core value proposition is simple: at any point during or after deployment, you are exactly one routing change away from your last known-good state.
For ML systems specifically, blue-green deployment addresses challenges that traditional software deployment does not face: long model loading times (making rolling restarts impractical), non-deterministic model behavior (making unit tests insufficient), and silent quality regressions (making post-deployment monitoring critical). The validation gate pattern -- health checks, latency benchmarks, prediction distribution comparison, and business metric monitoring -- provides a structured framework for catching issues before they reach all users.
The primary tradeoff is cost: running two environments simultaneously doubles infrastructure spend during the deployment window. For GPU-heavy workloads, this overhead can be significant (~$500-5,000/month depending on fleet size and deployment frequency). Practical mitigation strategies include spot instances for the green fleet, shorter baking periods enabled by better offline validation, and right-sizing the green fleet during the validation phase.
The Bottom Line: Blue-green deployment is the right choice when the cost of a bad model deployment exceeds the cost of maintaining redundant infrastructure. For revenue-critical, safety-critical, or compliance-sensitive ML systems -- fraud detection at Razorpay, recommendation ranking at Flipkart, pricing models at ride-sharing platforms -- the answer is almost always yes. For lower-stakes models, evaluate canary or rolling updates as cheaper alternatives. The best teams use a portfolio approach: shadow testing for pre-validation, blue-green for critical models, and canary for routine updates.