Fairness Checker in Machine Learning
A fairness checker is a component in an ML system that systematically evaluates whether a model's predictions treat different demographic or sensitive groups equitably. It sits downstream of a trained model and upstream of deployment gates, acting as a quantitative guardrail that flags disparities before they reach end users.
Why does this matter so much? Because ML models learn from historical data, and historical data encodes historical injustice. A lending model trained on a decade of loan approvals will inevitably absorb patterns where women, Scheduled Castes, or rural applicants were systematically denied credit -- not because they were higher risk, but because they were historically excluded. Without an explicit fairness check, these patterns propagate silently into production.
The discipline of algorithmic fairness has matured rapidly since 2016, producing over twenty formal fairness definitions, impossibility theorems that prove you cannot satisfy all of them simultaneously, and practical toolkits like Fairlearn, AI Fairness 360, and Google's What-If Tool that make auditing accessible to working engineers. A fairness checker operationalizes this research into a concrete pipeline stage.
From India's digital lending ecosystem (where the RBI's Fair Practices Code mandates non-discrimination) to hiring platforms processing millions of resumes, fairness checkers have become a regulatory and ethical necessity -- not a nice-to-have.
Concept Snapshot
- What It Is
- A systematic evaluation component that measures whether an ML model's predictions exhibit unjustified disparities across protected groups, using formal fairness metrics and statistical tests.
- Category
- Responsible AI
- Complexity
- Intermediate
- Inputs / Outputs
- Inputs: model predictions, ground-truth labels, sensitive attribute annotations (gender, caste, age, etc.). Outputs: fairness metric scores, disparity reports, pass/fail verdicts against configurable thresholds.
- System Placement
- Sits after model training and evaluation, before deployment. Often integrated into CI/CD pipelines as a deployment gate, and into monitoring systems for post-deployment auditing.
- Also Known As
- fairness auditor, bias evaluator, fairness assessment module, equity checker, algorithmic fairness monitor
- Typical Users
- ML Engineers, Data Scientists, Responsible AI Teams, Policy & Compliance Officers, Product Managers
- Prerequisites
- Binary and multi-class classification, Confusion matrix (TP, FP, TN, FN), Probability calibration basics, Understanding of protected/sensitive attributes
- Key Terms
- statistical paritydemographic parityequal opportunityequalized oddscalibrationdisparate impactgroup fairnessindividual fairnessimpossibility theoremPareto frontier
Why This Concept Exists
The Silent Propagation of Historical Bias
ML models are pattern-matching engines. When you train a model on data generated by a society with structural inequities, the model does not merely reflect those inequities -- it amplifies them. A credit scoring model trained on Indian banking data from 2010-2020 will learn that applicants from certain pin codes (often correlating with caste and economic status) have higher default rates. But those higher default rates themselves are partly a consequence of limited financial access, not inherent creditworthiness. The model mistakes correlation for causation and locks in a self-reinforcing cycle.
This is not hypothetical. In 2018, Amazon discovered that its AI hiring tool systematically penalized resumes containing the word "women's" (as in "women's chess club captain") and the names of certain all-women's colleges. The tool had been trained on a decade of resumes submitted to Amazon, which were overwhelmingly male. The system faithfully reproduced this demographic skew as a ranking signal. Amazon scrapped the tool entirely.
From Ad-Hoc Checks to Systematic Evaluation
Early approaches to fairness were informal: someone on the team would spot-check predictions across a few demographic slices and eyeball the results. This approach fails for three reasons:
- It doesn't scale. Real systems have dozens of sensitive attributes and hundreds of intersectional subgroups.
- It lacks rigor. Without formal metrics and statistical tests, you cannot distinguish genuine disparity from random variation.
- It's not reproducible. Ad-hoc checks produce different results depending on who runs them and what they look for.
A fairness checker solves all three problems by automating the evaluation against a predefined set of metrics, thresholds, and protected groups.
Regulatory Pressure is Real
In India, the Reserve Bank of India's Fair Practices Code for lending mandates non-discrimination based on religion, caste, gender, marital status, age, or disability. The European Union's AI Act (effective 2026) classifies employment and credit scoring systems as "high-risk" and requires conformity assessments that include bias testing. In the United States, the EEOC has begun scrutinizing automated hiring tools for adverse impact.
Bottom Line: A fairness checker exists because (a) ML models inherit and amplify historical bias, (b) manual spot-checks don't scale or satisfy regulatory requirements, and (c) formal fairness metrics provide the quantitative rigor needed to make deployment decisions defensible.
Core Intuition & Mental Model
The Two-Question Framework
At its core, a fairness checker answers two questions:
- Are different groups getting different outcomes? (Observational fairness -- looking at prediction distributions.)
- Are different groups getting different error rates? (Error-rate fairness -- looking at how wrong the model is for each group.)
These are fundamentally different questions, and a model can pass one while failing the other. Statistical parity asks Question 1. Equal opportunity and equalized odds ask Question 2. Calibration asks a third question: "When the model says 70% probability, do 70% of cases across all groups actually turn out positive?"
The Scale Analogy
Imagine a pharmacist dispensing medication using a weighing scale. Group fairness asks: "Does the scale give the same average reading for pills from Bottle A and Bottle B?" Individual fairness asks: "If two pills weigh exactly the same, does the scale give them the same reading regardless of which bottle they came from?" Calibration asks: "When the scale reads 500mg, is the pill actually 500mg -- for pills from every bottle?"
A scale can be biased in different ways, and each fairness metric detects a different type of bias. The uncomfortable truth -- formalized by the impossibility theorem -- is that you cannot build a scale that satisfies all three properties simultaneously, unless either the scale is perfect (zero error) or both bottles contain pills of the same average weight (equal base rates).
Why This Matters Practically
Consider a lending model used by an Indian NBFC. If the model approves 60% of male applicants but only 35% of female applicants, that's a statistical parity violation. But maybe the underlying default rates genuinely differ due to historical access patterns. Equal opportunity would ask: "Among applicants who would actually repay, is the approval rate the same across genders?" This is a more targeted question -- and often the right one for high-stakes decisions.
The fairness checker's job is to compute all relevant metrics, present the tradeoffs clearly, and let human decision-makers choose which fairness criteria to prioritize given the domain context.
Technical Foundations
Notation
Let denote the true label (e.g., loan repaid vs. defaulted), the predicted label, a binary sensitive attribute (e.g., gender), and the model's predicted probability (score).
Group Fairness Metrics
1. Statistical Parity (Demographic Parity)
Requires the prediction to be independent of the sensitive attribute:
The statistical parity difference is:
A value of indicates perfect parity. The disparate impact ratio is the ratio of these probabilities; the 80% rule (from US employment law) considers a ratio below 0.8 as evidence of adverse impact.
2. Equal Opportunity
Requires equal true positive rates across groups:
This metric, introduced by Hardt, Price & Srebro (2016), ensures that qualified individuals have an equal chance of being correctly classified, regardless of group membership.
3. Equalized Odds
A stricter criterion requiring equal true positive rates and equal false positive rates:
4. Predictive Parity (Calibration by Group)
Requires equal positive predictive values:
5. Calibration
Requires that predicted probabilities match observed frequencies within each group:
Individual Fairness
Formalized by Dwork et al. (2012), individual fairness requires that similar individuals receive similar predictions. Given a task-specific distance metric over individuals and a distance metric over prediction distributions:
where is the model. The challenge is defining the metric -- what makes two individuals "similar" is domain-specific and often contested.
The Impossibility Theorem
Kleinberg, Mullainathan & Raghavan (2016) and Chouldechova (2017) independently proved that for a binary classifier, when base rates differ across groups (), it is mathematically impossible to simultaneously satisfy:
- Calibration
- Balance for the positive class (equal opportunity)
- Balance for the negative class
This impossibility result is the central theoretical constraint that every fairness checker must acknowledge. You must choose which metrics to prioritize -- and that choice is fundamentally a values decision, not a technical one.
Internal Architecture
A fairness checker is typically structured as a modular evaluation pipeline that accepts model predictions and sensitive attributes, computes a configurable set of fairness metrics, and produces structured reports with pass/fail verdicts. The architecture separates metric computation from policy enforcement, allowing organizations to customize thresholds without modifying the evaluation logic.
The architecture supports both batch evaluation (during model development and CI/CD) and streaming evaluation (monitoring deployed models in production). The metric engine is designed to be extensible -- adding a new fairness metric should require implementing a single interface without modifying the orchestration layer.
Key Components
Data Alignment Layer
Joins model predictions, ground-truth labels, and sensitive attribute annotations into a unified evaluation dataset. Handles missing sensitive attributes via proxy detection or imputation. Validates that group sizes meet minimum statistical significance thresholds.
Metric Engine
Computes configurable fairness metrics (statistical parity, equal opportunity, equalized odds, calibration, individual fairness) across all specified sensitive attributes and their intersections. Supports both binary and multi-class classification, as well as regression fairness metrics.
Threshold & Policy Module
Encodes organizational fairness policies as configurable thresholds (e.g., disparate impact ratio >= 0.8, equal opportunity difference <= 0.05). Supports per-metric, per-group, and per-use-case threshold overrides. Produces pass/fail verdicts.
Report Generator
Produces human-readable fairness reports with metric values, visualizations (group-wise ROC curves, calibration plots, demographic breakdowns), and actionable recommendations. Outputs structured JSON for programmatic consumption and HTML/PDF for stakeholder review.
Mitigation Recommender
When the fairness check fails, suggests appropriate mitigation strategies (reweighing, threshold adjustment, adversarial debiasing) based on which metrics failed and by how much. Optionally triggers automated mitigation pipelines.
Audit Trail & Versioning
Logs every fairness evaluation with timestamps, model versions, dataset hashes, metric results, and threshold configurations. Essential for regulatory compliance (RBI, EU AI Act) and internal governance.
Data Flow
The data flows through the fairness checker in three stages:
Stage 1 -- Alignment: Model predictions ( or ), ground-truth labels (), and sensitive attributes () are joined on a common identifier. Records with missing sensitive attributes are either excluded (conservative) or imputed (with appropriate caveats in the report).
Stage 2 -- Computation: The metric engine iterates over each configured fairness metric and each sensitive attribute (including intersections like gender x caste). For each combination, it computes the metric value, confidence interval, and statistical significance. This stage is embarrassingly parallel.
Stage 3 -- Adjudication: The threshold module compares computed metrics against policy thresholds, produces pass/fail verdicts, and the report generator assembles the final output. If any metric fails, the mitigation recommender is invoked.
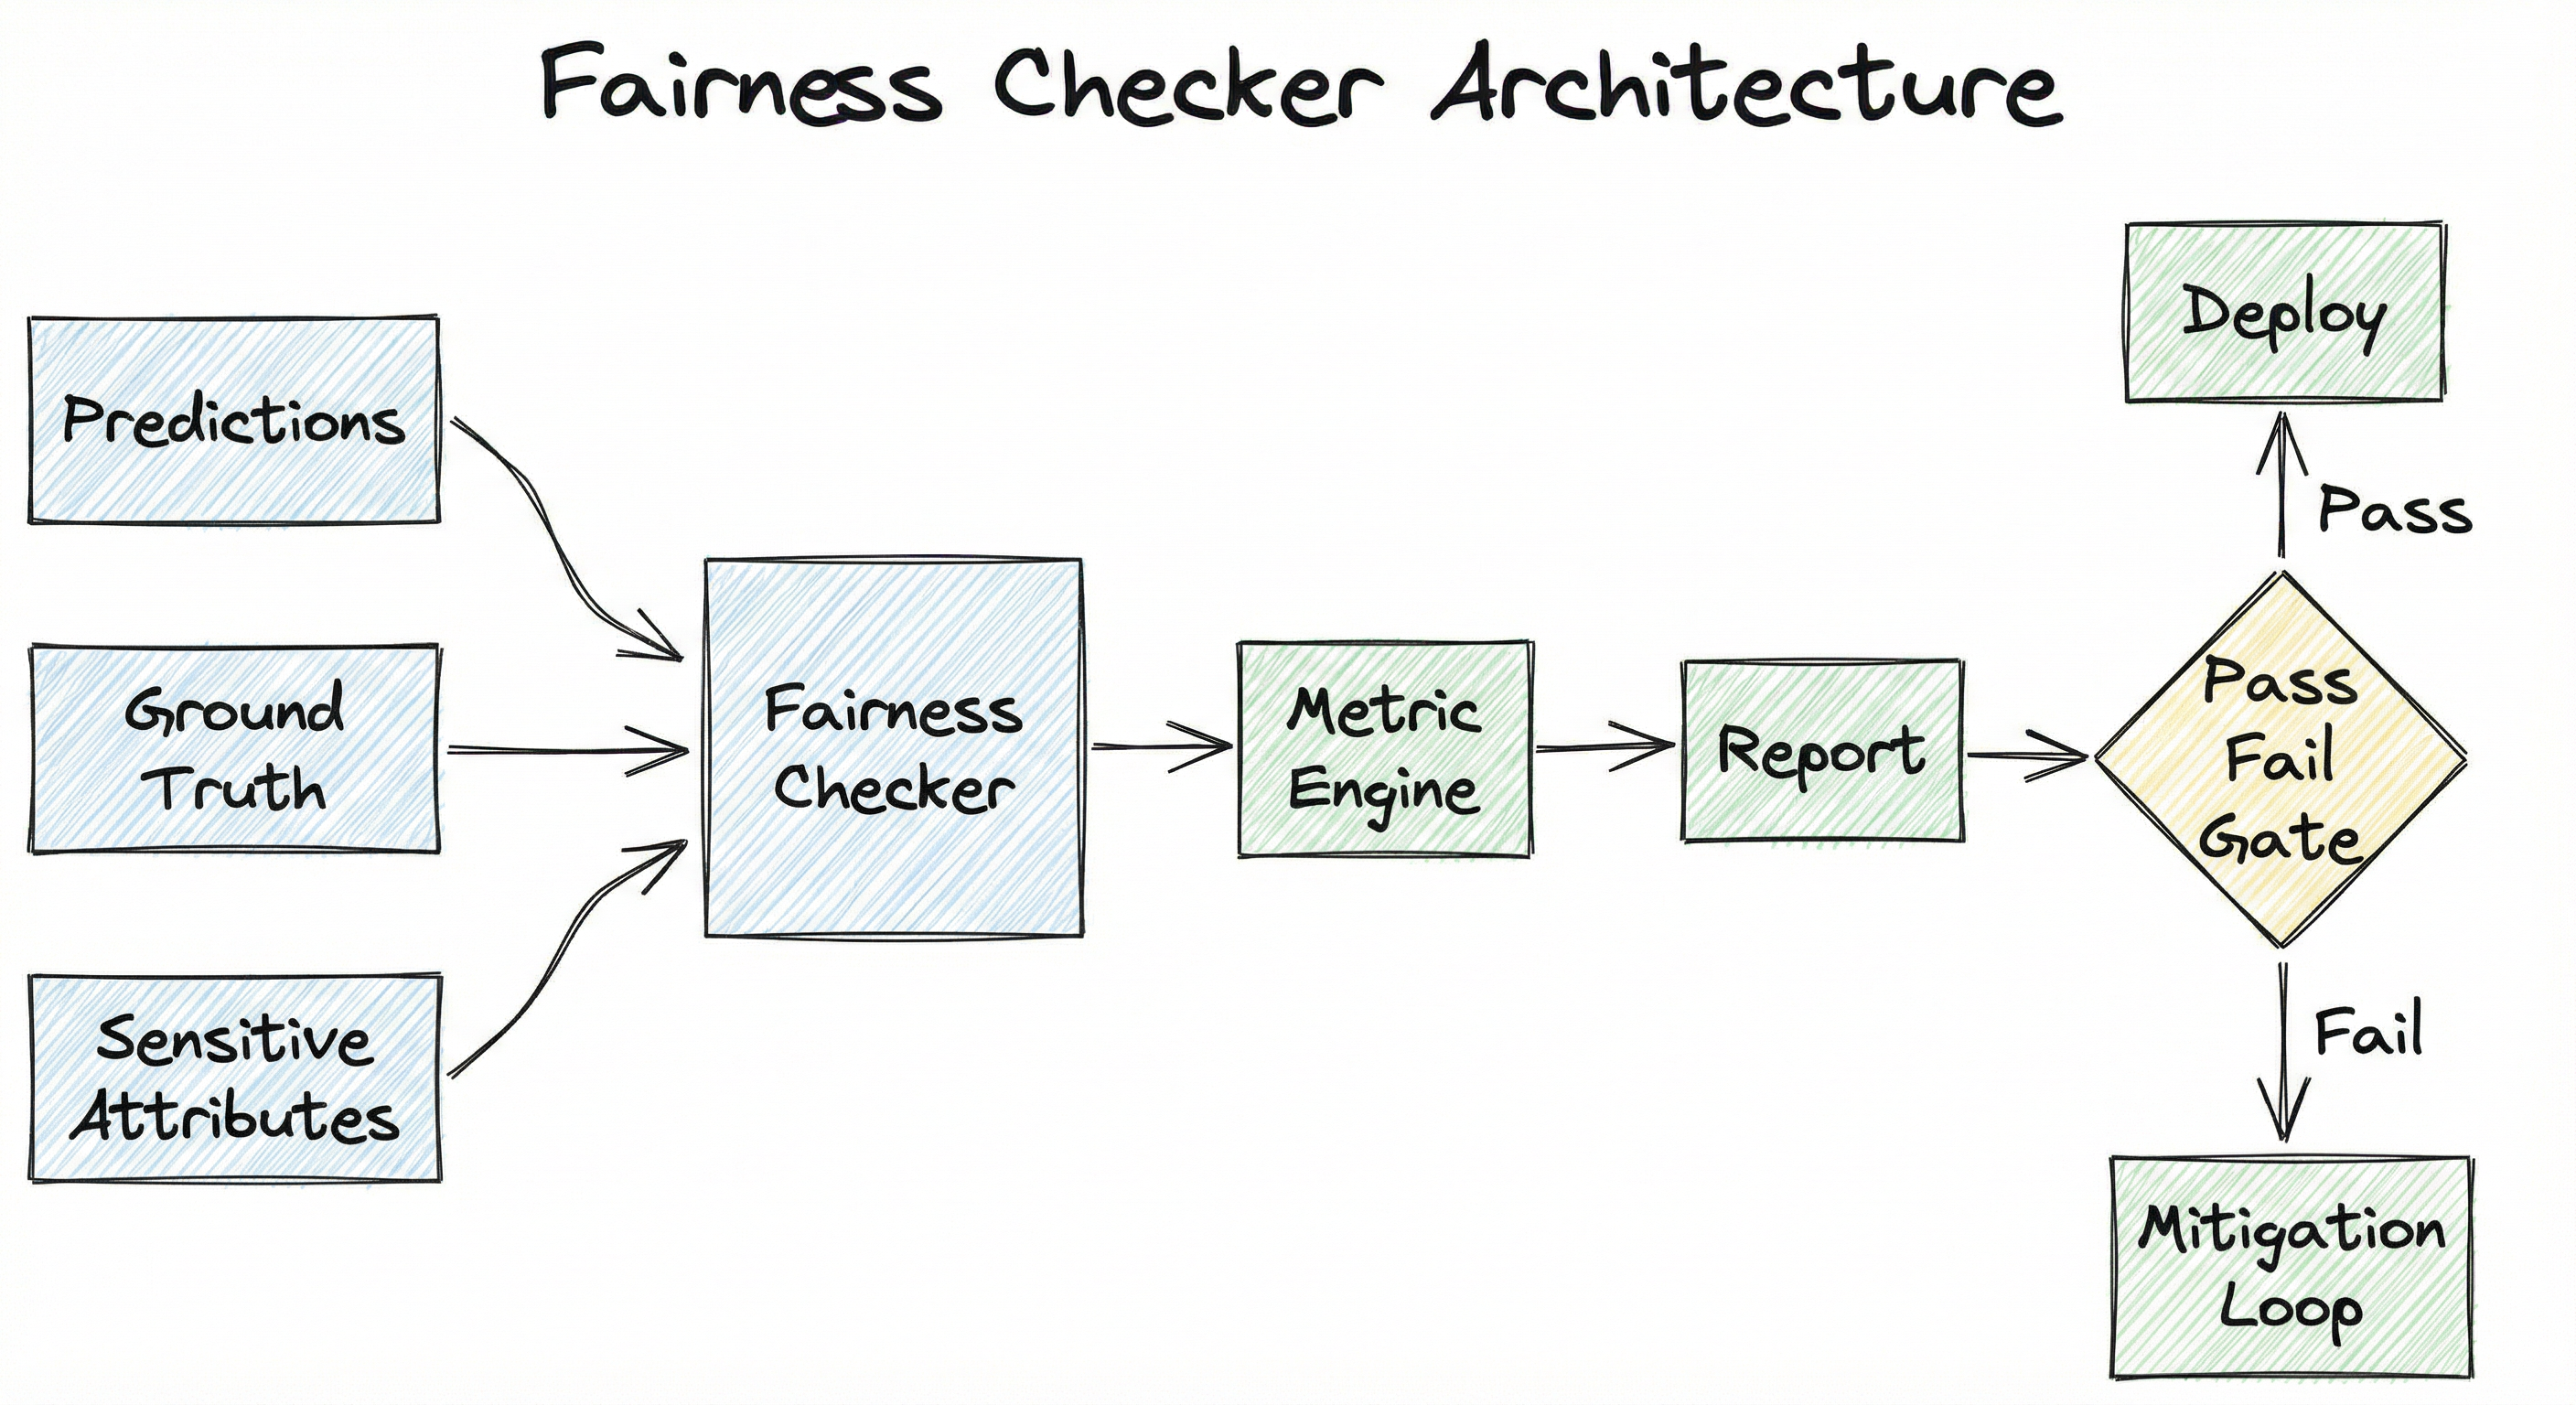
A directed flow from three inputs (Model Predictions, Ground Truth Labels, Sensitive Attributes) into a Fairness Checker, which feeds a Metric Engine that computes five fairness metrics in parallel (Statistical Parity, Equal Opportunity, Equalized Odds, Calibration, Individual Fairness). All metrics feed into a Report Generator, which produces a Fairness Report that goes through a Pass/Fail Gate. Passing leads to Deploy; failing leads to a Mitigation Loop that feeds back into Model Predictions.
How to Implement
Three Approaches to Implementation
Fairness checking can be implemented at three points in the ML lifecycle, and most production systems use all three:
Pre-processing checks examine the training data for representation imbalances and proxy variables before any model is trained. This catches problems early but cannot detect model-induced bias.
In-processing checks integrate fairness constraints directly into the training objective. The reductions approach by Agarwal et al. (2018) formulates fair classification as a sequence of cost-sensitive classification problems, yielding a classifier that minimizes empirical error subject to fairness constraints.
Post-processing checks evaluate and adjust the trained model's predictions. This is the most common approach for fairness checkers because it's model-agnostic -- you can audit any model without modifying its training. Hardt et al. (2016) showed that you can derive group-specific thresholds that achieve equal opportunity by solving a simple linear program.
Cost Note: Running a comprehensive fairness audit (5 metrics x 4 sensitive attributes x 10 intersections) on a dataset of 1M records takes about 2-5 minutes on a single CPU core. On an Azure Standard_D4s_v3 instance (~INR 12,000/month or ~$143/month), you can run hundreds of audits per day. The computational cost is negligible compared to model training -- the real cost is in the human time required to interpret results and make policy decisions.
Handling Sensitive Attribute Availability
A persistent practical challenge is that sensitive attributes (caste, religion, disability status) are often not collected, either due to privacy regulations or organizational policy. Three approaches exist:
- Direct collection with consent: The cleanest approach, but requires careful data governance.
- Proxy inference: Use correlated features (name, pin code, language) to infer demographic membership. This introduces noise and ethical concerns.
- Bayesian Improved Surname Geocoding (BISG): Widely used in US lending fairness audits, combines surname and geography to probabilistically estimate race. India-specific variants using name patterns and pin-code demographics are emerging.
import numpy as np
from sklearn.ensemble import GradientBoostingClassifier
from sklearn.model_selection import train_test_split
from fairlearn.metrics import (
    MetricFrame,
    demographic_parity_difference,
    demographic_parity_ratio,
    equalized_odds_difference,
    selection_rate,
    true_positive_rate,
    false_positive_rate,
)
from fairlearn.reductions import ExponentiatedGradient, DemographicParity

# --- Step 1: Load data and train baseline model ---
# X: features, y: labels, sensitive: protected attribute (e.g., gender)
X_train, X_test, y_train, y_test, sens_train, sens_test = train_test_split(
    X, y, sensitive_feature, test_size=0.3, random_state=42
)

baseline_model = GradientBoostingClassifier(n_estimators=100, random_state=42)
baseline_model.fit(X_train, y_train)
y_pred = baseline_model.predict(X_test)

# --- Step 2: Compute fairness metrics ---
metric_frame = MetricFrame(
    metrics={
        "selection_rate": selection_rate,
        "true_positive_rate": true_positive_rate,
        "false_positive_rate": false_positive_rate,
    },
    y_true=y_test,
    y_pred=y_pred,
    sensitive_features=sens_test,
)

print("=== Baseline Fairness Report ===")
print(f"Overall selection rate: {selection_rate(y_test, y_pred):.3f}")
print(f"\nMetrics by group:\n{metric_frame.by_group}")
print(f"\nDemographic parity difference: {demographic_parity_difference(y_test, y_pred, sensitive_features=sens_test):.4f}")
print(f"Demographic parity ratio: {demographic_parity_ratio(y_test, y_pred, sensitive_features=sens_test):.4f}")
print(f"Equalized odds difference: {equalized_odds_difference(y_test, y_pred, sensitive_features=sens_test):.4f}")

# --- Step 3: Apply fairness-constrained retraining ---
constraint = DemographicParity()
mitigator = ExponentiatedGradient(baseline_model, constraint)
mitigator.fit(X_train, y_train, sensitive_features=sens_train)
y_pred_fair = mitigator.predict(X_test)

print("\n=== After Mitigation ===")
print(f"Demographic parity difference: {demographic_parity_difference(y_test, y_pred_fair, sensitive_features=sens_test):.4f}")
print(f"Equalized odds difference: {equalized_odds_difference(y_test, y_pred_fair, sensitive_features=sens_test):.4f}")
This example demonstrates the full fairness checking workflow using Fairlearn: (1) train a baseline model, (2) compute fairness metrics using MetricFrame which slices performance by sensitive groups, and (3) apply the Exponentiated Gradient mitigation algorithm with a Demographic Parity constraint. The reductions approach reformulates fair classification as a sequence of cost-sensitive problems, producing a randomized classifier that satisfies the fairness constraint while minimizing error. The MetricFrame is the core abstraction -- it computes any scikit-learn-compatible metric across demographic slices.
from aif360.datasets import BinaryLabelDataset
from aif360.metrics import BinaryLabelDatasetMetric, ClassificationMetric
from aif360.algorithms.preprocessing import Reweighing
from aif360.algorithms.postprocessing import EqOddsPostprocessing
import pandas as pd
import numpy as np

# --- Step 1: Create AIF360 dataset ---
df = pd.DataFrame({
    "income": features[:, 0],
    "education": features[:, 1],
    "gender": sensitive_attr,  # 0 = female, 1 = male
    "approved": labels,
})

dataset = BinaryLabelDataset(
    df=df,
    label_names=["approved"],
    protected_attribute_names=["gender"],
    favorable_label=1.0,
    unfavorable_label=0.0,
)

# --- Step 2: Measure dataset-level bias ---
privileged_groups = [{"gender": 1}]
unprivileged_groups = [{"gender": 0}]

dataset_metric = BinaryLabelDatasetMetric(
    dataset,
    unprivileged_groups=unprivileged_groups,
    privileged_groups=privileged_groups,
)

print("=== Dataset Bias Metrics ===")
print(f"Disparate impact: {dataset_metric.disparate_impact():.3f}")
print(f"Statistical parity difference: {dataset_metric.statistical_parity_difference():.3f}")
print(f"Consistency (individual fairness): {dataset_metric.consistency():.3f}")

# --- Step 3: Apply reweighing to mitigate dataset bias ---
reweigher = Reweighing(
    unprivileged_groups=unprivileged_groups,
    privileged_groups=privileged_groups,
)
reweighed_dataset = reweigher.fit_transform(dataset)
print(f"\nPost-reweighing disparate impact: {BinaryLabelDatasetMetric(reweighed_dataset, unprivileged_groups=unprivileged_groups, privileged_groups=privileged_groups).disparate_impact():.3f}")

# --- Step 4: Post-processing for equalized odds ---
# Assumes y_pred_proba are model predicted probabilities
classification_metric = ClassificationMetric(
    dataset,
    classified_dataset,
    unprivileged_groups=unprivileged_groups,
    privileged_groups=privileged_groups,
)

print(f"\n=== Classification Fairness Metrics ===")
print(f"Equal opportunity difference: {classification_metric.equal_opportunity_difference():.4f}")
print(f"Average odds difference: {classification_metric.average_odds_difference():.4f}")
print(f"Theil index: {classification_metric.theil_index():.4f}")
AI Fairness 360 (AIF360) by IBM provides a comprehensive bias detection and mitigation toolkit. This example shows: (1) wrapping data as a BinaryLabelDataset with explicit privileged/unprivileged group definitions, (2) measuring dataset-level bias using disparate impact and statistical parity, (3) applying reweighing as a pre-processing mitigation that adjusts sample weights to equalize label distributions across groups, and (4) computing classification-level fairness metrics including equal opportunity difference, average odds difference, and the Theil index (an individual fairness measure). AIF360 supports 9 mitigation algorithms spanning pre-processing, in-processing, and post-processing.
from dataclasses import dataclass, field
from typing import Dict, List, Optional, Tuple
import numpy as np
import json
import sys


@dataclass
class FairnessThresholds:
    """Configurable fairness thresholds for pass/fail gating."""
    max_demographic_parity_diff: float = 0.10
    min_disparate_impact_ratio: float = 0.80
    max_equal_opportunity_diff: float = 0.05
    max_equalized_odds_diff: float = 0.08
    max_calibration_diff: float = 0.05


@dataclass
class FairnessResult:
    metric_name: str
    value: float
    threshold: float
    passed: bool
    group_a_value: float
    group_b_value: float


def compute_fairness_metrics(
    y_true: np.ndarray,
    y_pred: np.ndarray,
    y_prob: np.ndarray,
    sensitive: np.ndarray,
    thresholds: FairnessThresholds,
) -> List[FairnessResult]:
    """Compute fairness metrics and apply threshold gating."""
    results = []
    groups = np.unique(sensitive)
    assert len(groups) == 2, "Binary sensitive attribute required"
    g0_mask = sensitive == groups[0]
    g1_mask = sensitive == groups[1]

    # Statistical Parity
    sr_0 = y_pred[g0_mask].mean()
    sr_1 = y_pred[g1_mask].mean()
    sp_diff = abs(sr_1 - sr_0)
    results.append(FairnessResult(
        "demographic_parity_difference", sp_diff,
        thresholds.max_demographic_parity_diff,
        sp_diff <= thresholds.max_demographic_parity_diff,
        sr_0, sr_1,
    ))

    # Disparate Impact Ratio
    di_ratio = min(sr_0, sr_1) / max(sr_0, sr_1) if max(sr_0, sr_1) > 0 else 1.0
    results.append(FairnessResult(
        "disparate_impact_ratio", di_ratio,
        thresholds.min_disparate_impact_ratio,
        di_ratio >= thresholds.min_disparate_impact_ratio,
        sr_0, sr_1,
    ))

    # Equal Opportunity (TPR parity)
    tpr_0 = y_pred[(g0_mask) & (y_true == 1)].mean() if (g0_mask & (y_true == 1)).sum() > 0 else 0.0
    tpr_1 = y_pred[(g1_mask) & (y_true == 1)].mean() if (g1_mask & (y_true == 1)).sum() > 0 else 0.0
    eo_diff = abs(tpr_1 - tpr_0)
    results.append(FairnessResult(
        "equal_opportunity_difference", eo_diff,
        thresholds.max_equal_opportunity_diff,
        eo_diff <= thresholds.max_equal_opportunity_diff,
        tpr_0, tpr_1,
    ))

    # Equalized Odds (max of TPR diff and FPR diff)
    fpr_0 = y_pred[(g0_mask) & (y_true == 0)].mean() if (g0_mask & (y_true == 0)).sum() > 0 else 0.0
    fpr_1 = y_pred[(g1_mask) & (y_true == 0)].mean() if (g1_mask & (y_true == 0)).sum() > 0 else 0.0
    eod_diff = max(abs(tpr_1 - tpr_0), abs(fpr_1 - fpr_0))
    results.append(FairnessResult(
        "equalized_odds_difference", eod_diff,
        thresholds.max_equalized_odds_diff,
        eod_diff <= thresholds.max_equalized_odds_diff,
        max(tpr_0, fpr_0), max(tpr_1, fpr_1),
    ))

    return results


def run_fairness_gate(
    y_true: np.ndarray,
    y_pred: np.ndarray,
    y_prob: np.ndarray,
    sensitive: np.ndarray,
    thresholds: Optional[FairnessThresholds] = None,
) -> bool:
    """Run fairness gate; returns True if all checks pass."""
    if thresholds is None:
        thresholds = FairnessThresholds()

    results = compute_fairness_metrics(y_true, y_pred, y_prob, sensitive, thresholds)
    all_passed = all(r.passed for r in results)

    report = {
        "passed": all_passed,
        "metrics": [
            {
                "name": r.metric_name,
                "value": round(r.value, 4),
                "threshold": r.threshold,
                "passed": r.passed,
                "group_a": round(r.group_a_value, 4),
                "group_b": round(r.group_b_value, 4),
            }
            for r in results
        ],
    }
    print(json.dumps(report, indent=2))

    if not all_passed:
        failed = [r.metric_name for r in results if not r.passed]
        print(f"\nFAIRNESS GATE FAILED: {', '.join(failed)}")
        sys.exit(1)

    print("\nFAIRNESS GATE PASSED")
    return True
This custom implementation shows how to build a CI/CD fairness gate that blocks model deployment when fairness thresholds are violated. The FairnessThresholds dataclass holds configurable thresholds for each metric (the 80% disparate impact rule, 5% equal opportunity tolerance, etc.). The compute_fairness_metrics function calculates each metric from raw arrays, and run_fairness_gate produces a structured JSON report and exits with code 1 on failure -- integrating cleanly with CI/CD tools like GitHub Actions or Jenkins. In production, you would extend this with confidence intervals, intersectional analysis, and audit logging.
import numpy as np
from scipy.optimize import minimize_scalar
from sklearn.metrics import accuracy_score


def find_equalized_thresholds(
    y_true: np.ndarray,
    y_prob: np.ndarray,
    sensitive: np.ndarray,
    target_tpr: float = None,
) -> dict:
    """
    Find group-specific classification thresholds that equalize
    true positive rates (equal opportunity) while maximizing accuracy.

    Based on Hardt, Price & Srebro (2016).
    """
    groups = np.unique(sensitive)
    thresholds = {}

    if target_tpr is None:
        # Use the overall TPR at threshold=0.5 as the target
        baseline_pred = (y_prob >= 0.5).astype(int)
        positives = y_true == 1
        target_tpr = baseline_pred[positives].mean()

    for group in groups:
        mask = sensitive == group
        pos_mask = mask & (y_true == 1)
        group_probs_pos = y_prob[pos_mask]

        def tpr_error(threshold):
            pred = (group_probs_pos >= threshold).astype(int)
            achieved_tpr = pred.mean() if len(pred) > 0 else 0.0
            return (achieved_tpr - target_tpr) ** 2

        result = minimize_scalar(tpr_error, bounds=(0.01, 0.99), method="bounded")
        thresholds[group] = round(result.x, 4)

    # Verify equalization
    for group in groups:
        mask = (sensitive == group) & (y_true == 1)
        pred = (y_prob[mask] >= thresholds[group]).astype(int)
        achieved_tpr = pred.mean()
        print(f"Group {group}: threshold={thresholds[group]}, TPR={achieved_tpr:.4f}")

    # Compute accuracy with group-specific thresholds
    y_pred_fair = np.zeros_like(y_true)
    for group in groups:
        mask = sensitive == group
        y_pred_fair[mask] = (y_prob[mask] >= thresholds[group]).astype(int)

    acc = accuracy_score(y_true, y_pred_fair)
    print(f"\nAccuracy with equalized thresholds: {acc:.4f}")
    print(f"Target TPR: {target_tpr:.4f}")

    return thresholds
This implements the post-processing threshold adjustment approach from Hardt et al. (2016). Instead of using a single classification threshold for all groups, it finds group-specific thresholds that equalize the true positive rate (equal opportunity). For each group, it searches for the threshold that achieves a target TPR using bounded scalar optimization. This is the simplest and most practical fairness intervention -- it requires no model retraining, works with any classifier that outputs probabilities, and the accuracy cost is typically small (1-3%). This approach is widely used in lending and hiring applications.
# fairness_checker_config.yaml
fairness_checker:
  sensitive_attributes:
    - name: gender
      values: [male, female, non_binary]
      reference_group: male
    - name: caste_category
      values: [general, obc, sc, st]
      reference_group: general
    - name: age_group
      values: [18-25, 26-40, 41-60, 60+]
      reference_group: 26-40

  metrics:
    - name: demographic_parity_difference
      threshold: 0.10
      direction: lower_is_better
    - name: disparate_impact_ratio
      threshold: 0.80
      direction: higher_is_better
    - name: equal_opportunity_difference
      threshold: 0.05
      direction: lower_is_better
    - name: equalized_odds_difference
      threshold: 0.08
      direction: lower_is_better
    - name: calibration_difference
      threshold: 0.05
      direction: lower_is_better

  intersectional_analysis:
    enabled: true
    min_group_size: 200
    attribute_pairs:
      - [gender, caste_category]
      - [gender, age_group]

  reporting:
    format: [json, html]
    include_confidence_intervals: true
    confidence_level: 0.95
    output_dir: ./fairness_reports/

  ci_cd_gate:
    enabled: true
    fail_on: any  # any | majority | critical_only
    critical_metrics:
      - equal_opportunity_difference
      - disparate_impact_ratio
Common Implementation Mistakes
- ●
Checking only one metric: Teams often compute statistical parity alone and declare the model "fair." But a model can satisfy statistical parity while having wildly different error rates across groups. Always compute at least three metrics (statistical parity, equal opportunity, and calibration) to get a holistic picture.
- ●
Ignoring intersectionality: Evaluating fairness for gender and caste separately can miss compounding disparities. A model might be fair for women overall and fair for Scheduled Castes overall, but severely unfair for Scheduled Caste women. Intersectional analysis is essential, though it requires larger evaluation datasets to maintain statistical power.
- ●
Using proxy features as sensitive attributes: Pin codes, names, and language preferences correlate with caste, religion, and socioeconomic status in India. If your model uses these as features while you audit on the direct sensitive attribute, the model can discriminate through proxies while passing the fairness check on the direct attribute. Always audit proxy features too.
- ●
Setting thresholds without domain context: A 10% demographic parity difference might be acceptable for a movie recommendation system but catastrophic for a bail decision model. Thresholds must be set in consultation with domain experts, legal teams, and affected communities -- not by copying defaults from a tutorial.
- ●
Confusing fairness of the model with fairness of the system: A model might have perfect equalized odds, but if the downstream business process uses the model's output differently for different groups (e.g., applying stricter manual review to certain demographics), the overall system is still unfair. The fairness checker must be part of a broader audit.
- ●
Insufficient sample sizes per group: Computing fairness metrics on a subgroup with 50 samples produces estimates with huge confidence intervals. A metric value of 0.12 might have a 95% CI of [0.02, 0.22], making the pass/fail verdict meaningless. Always report confidence intervals and require minimum sample sizes (typically 200+ per group).
When Should You Use This?
Use When
Your model makes decisions about people (lending, hiring, insurance, criminal justice, healthcare triage) where disparate treatment has legal or ethical consequences
You operate in a regulated domain where fairness audits are mandated (RBI Fair Practices Code, EU AI Act high-risk categories, US EEOC adverse impact testing)
Your training data reflects historical biases (e.g., Indian lending data where women and lower-caste applicants were historically underserved)
You need to build trust with users and stakeholders by demonstrating that your ML system has been audited for bias
Your model uses features that are proxies for protected attributes (pin code, name, language) and you need to verify that these proxies do not create indirect discrimination
You are deploying a model at scale where even small per-group disparities affect thousands or millions of people
You need a quantitative basis for comparing multiple model variants on fairness criteria before selecting one for deployment
Avoid When
The model's output does not differentially affect people based on group membership (e.g., predicting weather, equipment failure, or stock prices). Fairness checking is about human impact.
You lack sensitive attribute data and have no reliable way to infer it -- running a fairness checker without group labels produces meaningless results. Invest in data collection first.
The evaluation dataset is too small to compute statistically meaningful fairness metrics (fewer than 100 samples per group). You'll get noisy estimates that create a false sense of security.
You're using fairness checking as a box-ticking exercise without genuine organizational commitment to act on the results. A fairness checker that flags problems but never blocks deployments is worse than no checker at all -- it provides false assurance.
The fairness concern is better addressed by changing the problem formulation entirely rather than post-hoc auditing (e.g., if the label itself is biased, no amount of fairness checking on the model will help)
Key Tradeoffs
The Fundamental Tradeoff: Fairness vs. Accuracy
Enforcing fairness constraints almost always reduces overall model accuracy. The question is: by how much? Empirically, the cost is often small. Studies on the COMPAS recidivism dataset and German Credit dataset show that achieving equalized odds typically costs 1-5% in overall accuracy. For equal opportunity alone, the cost is often under 2%.
However, the cost distribution is uneven. When you enforce statistical parity on a model where base rates genuinely differ across groups, you're forcing the model to accept more false positives in one group and more false negatives in another. The net accuracy drop is concentrated in the groups where the constraint binds hardest.
| Metric Enforced | Typical Accuracy Cost | Best For | Worst For |
|---|---|---|---|
| Statistical Parity | 3-8% | Equal representation goals | When base rates genuinely differ |
| Equal Opportunity | 1-3% | Ensuring qualified individuals aren't missed | When FPR disparity is also a concern |
| Equalized Odds | 2-5% | Balanced error rates | When strict accuracy is paramount |
| Calibration | 0-2% | Probability-based decisions | When groups have very different feature distributions |
The Impossibility Constraint
The Kleinberg-Chouldechova impossibility theorem means you cannot have your cake and eat it too. If base rates differ (and they almost always do in real data), you must choose between calibration and error-rate parity. This is not a technical limitation -- it's a mathematical fact.
For Indian lending applications, this means a fairness checker might report that a model is calibrated across genders (when the model says 80% repayment probability, 80% of both men and women repay) but still has unequal approval rates. Alternatively, you can equalize approval rates, but then the model's probability estimates become miscalibrated for at least one group.
Practical Guidance: For high-stakes decisions (credit, hiring, healthcare), prioritize equal opportunity -- ensuring qualified individuals aren't systematically missed. For lower-stakes decisions (content recommendations, ad targeting), statistical parity may be more appropriate. Always document the choice and the rationale.
Alternatives & Comparisons
A bias detector focuses on identifying the sources of bias in data and features (representation imbalance, label bias, proxy variables), while a fairness checker evaluates the outcomes of a trained model against formal fairness metrics. Use a bias detector upstream during data preparation; use a fairness checker downstream after model training. Most production systems need both.
SHAP provides feature-level explanations (which features drove a particular prediction) but does not directly compute group fairness metrics. You can use SHAP to diagnose why a fairness metric failed (e.g., discovering that the pin code feature contributes disproportionately to predictions for one group), but SHAP alone is not a fairness checker. They are complementary: the fairness checker flags the problem, SHAP helps you understand the mechanism.
Like SHAP, LIME provides local interpretability (why did the model make this specific prediction?) rather than group-level fairness assessment. LIME can help investigate individual cases that appear unfair, but it does not compute statistical metrics across demographic groups. Use LIME for case-by-case investigation after a fairness checker flags a systemic disparity.
A human-in-the-loop system inserts human judgment into the decision pipeline, often as a review step for edge cases. While this can catch individual unfair decisions, it does not provide the systematic, scalable, quantitative evaluation that a fairness checker offers. Conversely, a fairness checker cannot exercise the contextual judgment that a human reviewer brings. The best systems combine both: the fairness checker handles systematic evaluation, and human reviewers handle nuanced cases.
Pros, Cons & Tradeoffs
Advantages
Quantitative rigor replaces subjective judgments -- you get precise metric values, confidence intervals, and pass/fail verdicts rather than someone's gut feeling about whether the model is "fair enough"
Automated CI/CD integration means every model version is audited before deployment, preventing regression on fairness metrics. This catches problems that manual spot-checks would miss.
Regulatory compliance becomes demonstrable -- you have timestamped audit trails showing which metrics were computed, what thresholds were applied, and whether the model passed. This is directly useful for RBI audits, EU AI Act conformity assessments, and EEOC investigations.
Multiple stakeholder alignment becomes possible because fairness metrics provide a shared vocabulary for conversations between ML engineers, product managers, legal teams, and executives. Instead of vague debates, you discuss specific metric tradeoffs.
Intersectional analysis reveals hidden disparities that no human reviewer would catch by manually inspecting predictions. A fairness checker can evaluate hundreds of subgroup combinations in seconds.
Model comparison on fairness axes enables principled selection between multiple candidate models. You can plot the Pareto frontier of accuracy vs. fairness and choose the model that best fits your organizational values.
Post-deployment monitoring detects fairness drift -- gradual changes in model behavior as the data distribution shifts. A model that was fair at launch can become unfair over time if population demographics or feature distributions change.
Disadvantages
Impossibility constraints mean you cannot satisfy all fairness metrics simultaneously (when base rates differ), forcing difficult value judgments that the tool itself cannot make. The fairness checker tells you what is unfair; it cannot tell you which unfairness to tolerate.
Sensitive attribute availability is a persistent practical barrier. Many organizations do not collect caste, religion, or disability data, making direct fairness evaluation impossible. Proxy-based inference introduces noise and its own ethical concerns.
Metric gaming is a real risk: teams may optimize for the specific metrics being checked while introducing subtler forms of discrimination that the chosen metrics don't capture. A model can pass a statistical parity check while still being deeply unfair in ways not measured.
False confidence can arise when a model passes a fairness check -- stakeholders may incorrectly believe the model is "fair" in an absolute sense, when it has only been shown to satisfy specific mathematical criteria under specific conditions.
Computational overhead for intersectional analysis grows combinatorially: with sensitive attributes each having values, the number of intersectional subgroups is . For 5 attributes with 4 values each, that's 1,024 subgroups, many with insufficient sample sizes.
Accuracy cost is real, even if often modest. In competitive markets (e.g., Indian digital lending where margins are thin), even a 2-3% accuracy drop translates to measurable revenue impact, creating organizational resistance to fairness constraints.
Failure Modes & Debugging
Simpson's Paradox in Subgroup Analysis
Cause
Aggregating fairness metrics across subgroups can mask disparities within subgroups. A model might appear fair at the overall gender level because the unfairness in one age bracket is offset by reverse unfairness in another. This is a statistical phenomenon, not a bug in the checker.
Symptoms
Overall fairness metrics pass, but complaints or adverse outcomes concentrate in specific intersectional subgroups (e.g., young women, or elderly Scheduled Caste applicants). External audits reveal disparities that internal checks missed.
Mitigation
Always run intersectional analysis alongside aggregate analysis. Configure the fairness checker to evaluate all pairwise and (where sample size permits) three-way intersections of sensitive attributes. Report the worst-performing subgroup, not just the average.
Stale Sensitive Attribute Data
Cause
Sensitive attribute annotations collected at one point in time may become outdated (people move to different regions, change marital status, transition gender). The fairness checker evaluates against stale labels, producing incorrect metric values.
Symptoms
Fairness metrics show unexpected trends or contradict external benchmarks. Metrics for demographic groups don't match known population proportions. The checker passes models that stakeholders perceive as unfair based on recent feedback.
Mitigation
Refresh sensitive attribute data periodically. Cross-validate against census data or external demographic surveys. Track the age of sensitive attribute annotations and flag evaluations where data is older than a defined threshold (e.g., 2 years).
Threshold Manipulation (Goodhart's Law)
Cause
When teams are evaluated on whether they pass the fairness gate, they may optimize specifically for the checked metrics rather than genuinely improving fairness. For instance, adjusting classification thresholds to barely pass the disparate impact ratio while introducing other forms of disparity.
Symptoms
Models consistently pass fairness checks by narrow margins. Fairness metrics improve while user complaints about unfair treatment persist. External audits reveal patterns of discrimination that internal metrics miss.
Mitigation
Rotate and expand the set of metrics checked over time. Include qualitative fairness reviews alongside quantitative checks. Monitor downstream outcomes (actual loan default rates by group, actual hiring outcomes) in addition to prediction-time metrics.
Proxy Discrimination Bypass
Cause
The model discriminates through proxy features (pin code correlating with caste, first name correlating with religion) while passing fairness checks computed on the direct sensitive attribute. This is especially prevalent in India where geographic, linguistic, and onomastic features are strong proxies for caste and religion.
Symptoms
Fairness metrics on the direct sensitive attribute pass, but applying the same metrics using proxy-inferred group membership reveals significant disparities. Affected communities report discriminatory outcomes despite the model being "certified fair."
Mitigation
Audit not just on declared sensitive attributes but also on proxy-inferred groups. Use SHAP or LIME to check whether proxy features have disproportionate influence on predictions for certain groups. Consider removing or regularizing high-correlation proxies.
Insufficient Statistical Power
Cause
Evaluation datasets have too few samples in minority groups to compute fairness metrics with meaningful precision. In Indian contexts, Scheduled Tribes may constitute 2-3% of the evaluation set, yielding unreliable metric estimates.
Symptoms
Confidence intervals on fairness metrics are extremely wide. Results are unstable -- a different random seed or train-test split produces dramatically different verdicts. The checker alternates between pass and fail on consecutive runs.
Mitigation
Set minimum sample size requirements per group (200+ recommended). Use stratified sampling to ensure adequate minority representation in evaluation datasets. Report confidence intervals alongside point estimates and flag results where the CI crosses the threshold.
Label Bias Masking True Unfairness
Cause
The ground-truth labels themselves are biased (e.g., historical hiring data where qualified women were rejected, or lending data where creditworthy lower-caste applicants were denied). The fairness checker computes metrics against these biased labels, so a model that reproduces the bias appears "fair" relative to the biased ground truth.
Symptoms
All fairness metrics pass, but the model perpetuates the same historical discrimination patterns present in the training data. Equal opportunity is satisfied because the model correctly predicts who was approved, not who should have been approved.
Mitigation
This is the hardest failure mode to detect and address. Consider using causal fairness approaches, external benchmark labels, or domain expert review to validate that ground-truth labels themselves are not systematically biased. For lending, compare model approval rates against external creditworthiness indicators (e.g., bureau scores obtained independently).
Placement in an ML System
Where Does It Sit in the Pipeline?
The fairness checker occupies a critical position as a deployment gate -- the last systematic check before a model enters production. It sits after model training and standard evaluation (accuracy, AUC, etc.) and before the model registry or serving infrastructure.
In a mature ML platform, the fairness checker is invoked in three contexts:
- Pre-deployment: As part of the CI/CD pipeline, every candidate model is evaluated against fairness thresholds. Failing the check blocks promotion to staging/production.
- A/B testing: When comparing a new model against the incumbent, fairness metrics are tracked alongside business metrics. A model that improves accuracy but degrades fairness should not be promoted.
- Post-deployment monitoring: Fairness metrics are computed on a rolling window of live predictions to detect fairness drift -- the gradual degradation of fairness as the data distribution shifts.
The fairness checker interacts closely with the bias detector (upstream, which examines data-level issues) and the human-in-the-loop module (downstream, which handles cases that require contextual judgment). Together, these three components form the backbone of a responsible AI pipeline.
Key Insight: The fairness checker is not a one-time gate but a continuous monitoring concern. A model that is fair at deployment can become unfair as population demographics shift, feature distributions change, or the model's predictions alter the very outcomes it was trained to predict (performativity).
Pipeline Stage
Evaluation / Deployment Gate
Upstream
- bias-detector
- model-training
- model-evaluation
Downstream
- human-in-loop
- model-registry
- model-serving
- monitoring
Scaling Bottlenecks
The primary bottleneck is intersectional analysis at scale. Computing fairness metrics for all pairwise intersections of 5 sensitive attributes (each with 4 values) produces 10 pairs x 16 subgroups = 160 metric computations per fairness metric. With 5 metrics, that's 800 computations per evaluation run. Each computation is where is the evaluation dataset size, so the total is -- linear but with a large constant.
For streaming/real-time monitoring, the bottleneck shifts to maintaining running statistics per subgroup without storing the full prediction history. Approximate data structures (t-digests, Count-Min sketches) can help, but introduce additional approximation error on top of the inherent metric uncertainty.
At the organizational level, the bottleneck is often human review bandwidth: when the fairness checker flags issues, qualified personnel must review the results, interpret the tradeoffs, and decide on mitigation strategies. This scales with the number of models, not the number of predictions.
Production Case Studies
LinkedIn discovered that its job recommendation algorithms ranked candidates partly based on application likelihood, which introduced gender bias -- men received more visibility because they applied more aggressively. LinkedIn built a fairness-aware re-ranking system that ensures representative distribution across genders in candidate recommendations, effectively implementing a real-time fairness checker in the serving layer.
The representational parity system significantly improved visibility for historically underrepresented candidates without negatively impacting key business metrics like recruiter response rates.
Amazon's automated resume screening tool was found to systematically penalize resumes containing words associated with women (e.g., "women's chess club") and names of all-women's colleges. The tool was trained on 10 years of predominantly male resumes. This case became a landmark example of why fairness checking must be integrated into the ML development lifecycle, not treated as an afterthought.
Amazon scrapped the tool entirely in 2017. The case became a catalyst for the ML fairness field, driving adoption of systematic fairness auditing in hiring AI across the industry.
Microsoft developed and open-sourced Fairlearn, a Python toolkit for assessing and improving ML fairness. The library provides MetricFrame for sliced fairness evaluation and the Exponentiated Gradient algorithm for fairness-constrained optimization. Fairlearn is used internally at Microsoft for auditing products including Azure AI services, LinkedIn features, and Xbox content recommendations.
Fairlearn has become one of the two dominant fairness toolkits (alongside IBM's AIF360), with over 1,800 GitHub stars and adoption across hundreds of organizations globally, including multiple Indian fintech companies for lending fairness audits.
The RBI's Framework for Responsible and Ethical Enablement (FREE) of AI in the Indian financial sector mandates that AI systems used for credit decisions must ensure non-discrimination across religion, caste, gender, and socioeconomic status. This regulatory framework is driving adoption of fairness checkers across Indian banks and NBFCs that use ML for credit scoring, personal loan approval, and insurance underwriting.
Indian fintech companies including Lendingkart, Capital Float, and KreditBee have begun integrating fairness evaluation into their ML pipelines to comply with RBI guidelines, with several reporting 15-25% reduction in gender-based approval disparities.
Google's PAIR team developed the What-If Tool (WIT), an interactive visualization tool for probing ML models without code. WIT includes a dedicated fairness tab that lets practitioners slice model performance by demographic groups, adjust classification thresholds, and visualize the impact on five fairness metrics simultaneously. It integrates with TensorBoard and Jupyter notebooks.
WIT has been integrated into Google Cloud's Vertex AI platform and is used internally across Google products. The tool's interactive threshold adjustment feature has been cited as particularly valuable for communicating fairness-accuracy tradeoffs to non-technical stakeholders.
Tooling & Ecosystem
Microsoft's open-source Python package for assessing and improving ML fairness. Provides MetricFrame for disaggregated metrics, the Exponentiated Gradient and Grid Search algorithms for fairness-constrained optimization, and integration with scikit-learn. Supports demographic parity, equalized odds, and custom constraints.
IBM's comprehensive fairness toolkit with 70+ metrics and 9 mitigation algorithms spanning pre-processing (reweighing, disparate impact remover), in-processing (adversarial debiasing, meta-fair classifier), and post-processing (equalized odds, reject option classification). Available in Python and R.
Interactive visual tool for ML model analysis and fairness evaluation. Features counterfactual exploration, performance slicing by demographic groups, and real-time threshold adjustment with fairness impact visualization. Integrates with TensorBoard, Jupyter, and Colab.
An open-source bias audit toolkit developed by the University of Chicago's Center for Data Science and Public Policy. Provides a simple API for computing group fairness metrics and generates visual bias reports. Designed for policy-oriented applications in criminal justice, education, and social services.
Framework for creating structured documentation of ML models, including fairness evaluation results. Model cards document intended use, evaluated fairness metrics, and known limitations. While not a fairness checker itself, it standardizes how fairness results are communicated.
A suite of tools including the Responsible AI Dashboard that integrates Fairlearn's metrics with error analysis, model interpretability, and causal inference in a single interactive UI. Designed for Azure ML but usable standalone. Provides actionable insights for debugging fairness issues.
Research & References
Hardt, Price & Srebro (2016)NeurIPS 2016
Introduced the equal opportunity criterion: requiring equal true positive rates across groups. Showed how to derive optimal group-specific thresholds via a simple post-processing step. One of the most cited papers in algorithmic fairness.
Dwork, Hardt, Pitassi, Reingold & Zemel (2012)ITCS 2012
Formalized individual fairness -- the principle that similar individuals should receive similar predictions. Introduced the Lipschitz condition framework where prediction distance is bounded by a task-specific similarity metric over individuals.
Agarwal, Beygelzimer, Dudik, Langford & Wallach (2018)ICML 2018
Reduced fair classification to a sequence of cost-sensitive classification problems solvable by any standard classifier. The Exponentiated Gradient algorithm provides strong theoretical guarantees and forms the core of Fairlearn's mitigation toolkit.
Kleinberg, Mullainathan & Raghavan (2016)ITCS 2017
Proved the impossibility theorem: calibration, balance for the positive class, and balance for the negative class cannot simultaneously hold when base rates differ. A foundational negative result that shapes all fairness checker design.
Verma & Rubin (2018)IEEE/ACM FairWare 2018
Catalogued and compared 20+ formal fairness definitions using a single unifying case study (German Credit Dataset). Essential reference for understanding the relationships and incompatibilities between different fairness metrics.
Sambasivan, Arnesen, Hutchinson, Doshi & Prabhakaran (2021)FAccT 2021
Argued that Western fairness frameworks (built around race and gender binaries) are insufficient for the Indian context, where caste, religion, and socioeconomic intersectionality require fundamentally different approaches to fairness operationalization.
Fabris, Bayas, Mehta, Honarvar Nazari & Kuo (2024)ACM Transactions on Intelligent Systems and Technology
Comprehensive multidisciplinary survey of fairness in hiring algorithms, covering technical metrics, legal frameworks, and organizational practices. Identifies key gaps between academic fairness research and real-world deployment practices.
Interview & Evaluation Perspective
Common Interview Questions
- ●
What are the key fairness metrics for a binary classifier, and when would you choose one over another?
- ●
Explain the impossibility theorem. How does it affect the design of a fairness checker?
- ●
How would you design a fairness evaluation pipeline for a lending model serving rural and urban India?
- ●
What is the difference between group fairness and individual fairness? Can you satisfy both?
- ●
Your model passes equal opportunity checks but fails statistical parity. What does this mean, and what would you recommend?
- ●
How would you handle fairness evaluation when sensitive attributes are not directly available in the data?
- ●
Describe the fairness-accuracy tradeoff. How would you present this tradeoff to a business stakeholder?
Key Points to Mention
- ●
Name at least three fairness metrics (statistical parity, equal opportunity, equalized odds, calibration) and explain the mathematical difference between them. Don't just list names -- show you understand the conditional probability distinctions.
- ●
Reference the impossibility theorem (Kleinberg/Chouldechova): calibration and error-rate parity cannot coexist when base rates differ. This shows you understand the theoretical limits of fairness checking.
- ●
Distinguish between pre-processing (data reweighing), in-processing (constrained optimization), and post-processing (threshold adjustment) mitigation approaches. Be able to recommend one based on the scenario.
- ●
Mention the proxy discrimination problem -- models can discriminate through correlated features even when sensitive attributes are excluded. This is especially relevant in the Indian context where pin code, name, and language are strong caste/religion proxies.
- ●
Discuss intersectional fairness: a model can be fair on gender and fair on caste individually but unfair for Scheduled Caste women. This shows mature thinking about fairness evaluation.
- ●
Reference real tooling (Fairlearn, AIF360, What-If Tool) and their strengths. This demonstrates you've actually worked with these systems, not just read about them.
Pitfalls to Avoid
- ●
Claiming there is a single 'correct' fairness metric -- the choice between metrics is a values decision, not a technical one. Interviewers will test whether you understand this nuance.
- ●
Treating fairness as a one-time checkbox rather than a continuous monitoring concern. Models drift, populations shift, and a model that is fair today can become unfair tomorrow.
- ●
Suggesting that removing sensitive attributes from the model input solves the fairness problem -- this is the 'fairness through unawareness' fallacy. Proxy features carry the same discriminatory signal.
- ●
Ignoring the business and legal context. A senior candidate should ask about the domain (lending? hiring? healthcare?) before recommending a fairness metric, because the appropriate metric depends on the use case.
- ●
Overlooking sample size requirements -- claiming a model is 'fair' based on metrics computed over 30 samples per group demonstrates statistical naivety.
Senior-Level Expectation
A senior or staff-level candidate should be able to: (1) Design an end-to-end fairness evaluation pipeline from scratch, including data alignment, metric computation, intersectional analysis, threshold setting, CI/CD gating, and post-deployment monitoring. (2) Discuss the impossibility theorem and its practical implications without hand-waving -- know the mathematical conditions under which it applies. (3) Navigate the fairness-accuracy Pareto frontier and articulate how to present tradeoffs to business stakeholders in terms they care about (revenue impact, regulatory risk, brand risk). (4) Reason about India-specific challenges: caste as a protected attribute, proxy discrimination through geographic and linguistic features, RBI regulatory requirements, and the limitations of Western fairness frameworks in the Indian context (citing Sambasivan et al., 2021). (5) Discuss causal fairness as an emerging alternative to observational fairness metrics, and when causal approaches are necessary (e.g., when the label itself is biased). (6) Estimate costs: a fairness audit pipeline on Azure running daily costs roughly INR 15,000-25,000/month ($180-300/month) including compute, storage, and monitoring infrastructure.
Summary
A fairness checker is a systematic evaluation component that measures whether an ML model's predictions exhibit unjustified disparities across protected demographic groups. It operationalizes the academic discipline of algorithmic fairness into a concrete, automatable pipeline stage.
The core of a fairness checker is its metric engine, which computes formal fairness metrics -- statistical parity (equal prediction rates), equal opportunity (equal true positive rates), equalized odds (equal TPR and FPR), and calibration (predicted probabilities match observed frequencies). The impossibility theorem by Kleinberg and Chouldechova proves that when base rates differ across groups, calibration and error-rate parity cannot simultaneously hold, forcing every fairness checker to acknowledge that the choice of metric is ultimately a values decision. Practical toolkits like Fairlearn (Microsoft), AI Fairness 360 (IBM), and the What-If Tool (Google) provide production-ready implementations of these metrics along with mitigation algorithms spanning pre-processing (reweighing), in-processing (constrained optimization via the Exponentiated Gradient), and post-processing (threshold adjustment).
In the Indian context, fairness checking faces unique challenges: caste as a protected attribute is complex and often not directly collected, proxy discrimination through geographic and onomastic features is pervasive, and the regulatory landscape (RBI Fair Practices Code, emerging AI guidelines) is evolving rapidly. The fairness-accuracy tradeoff is real but often modest (1-5% accuracy cost for most constraints), and the organizational investment in building the human processes to act on fairness findings is typically larger than the technical investment in computing the metrics. A mature fairness checking system operates as a continuous monitoring concern -- not a one-time gate -- because models that are fair at deployment can drift into unfairness as populations and distributions shift over time.